
BERKELEY, 1997
(Please note that this "study" was just a two day sampling at the site.)
AMBIENT AIR POLLUTION AND HEALTH RISKS AT THE HARRISON STREET SITE BERKELEY, CALIFORNIA
December 10, 1997
Letter Agreement Dated August 5, 1997 Acurex Environmental Project No. 6847
Acurex Environmental Corporation Mountain View, CaliforniaTABLE OF CONTENTS
SECTION 1 INTRODUCTION AND SUMMARY
SECTION 2 SITE AND SOURCE INFORMATION
2.1 SITE DESCRIPTION
2.2 SOURCES
2.2.1 Berkeley Forge
2.2.2 Pacific Steel Casting Company
2.2.3 Solid Waste Transfer Station
2.2.4 Freeway
2.2.5 Railroad
2.3 POLLUTANTS OF CONCERNSECTION 3 AMBIENT AIR POLLUTION MEASUREMENTS
3.1 TEST EVENT DESCRIPTION
3.1.1 Test Objective
3.1.2 Sampling Location
3.1.3 Test Dates and Times
3.1.4 Test Methods3.2 METEOROLOGICAL CONDITIONS
3.3 AMBIENT AIR POLLUTION CONCENTRATIONS
3.4 FORMALDEHYDE RESULTS
3.5 TOTAL PARTICULATE AND PM10 RESULTS
3.6 METALS RESULTS
3.7 SEM RESULTS
3.8 CONTINUOUS ANALYZER RESULTS FOR CRITERIA
POLLUTANT GASESSECTION 4 HEALTH RISK CALCULATIONS
4.1 RECEPTOR LOCATION
4.2 HEALTH RISK ASSESSMENT PROCEDURE
4.3 RISK AND EXPOSURE RESULTS
4.3.1 Acute Exposure Hazards
4.3.2 Chronic Exposure Hazards
4.3.3 Cancer RiskREFERENCE
SAPPENDIX A - AMBIENT AIR POLLUTION TESTS
APPENDIX B - HEALTH RISK INFORMATION
LIST OF TABLES
Table 1-1 Pollutants, potential sources, concentrations, and typical urban values
Table 1-2 Health risks for measured pollutant levels at the lower Harrison Street site
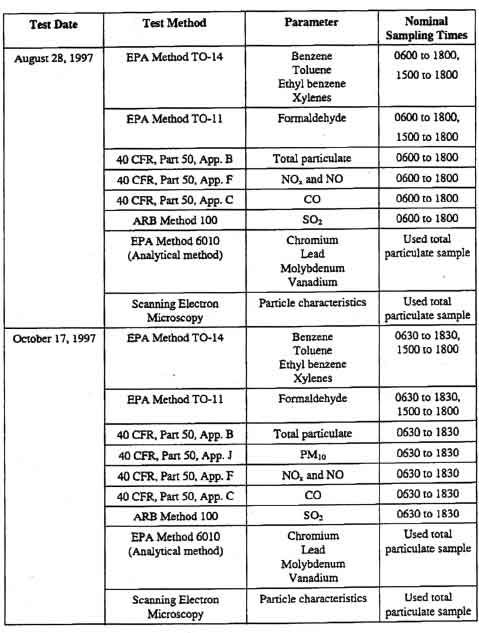
Table 3-1 Test methods and sampling times - lower Harrison Street site
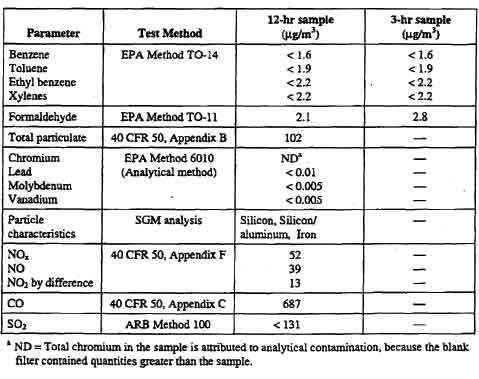
Table 3-2 Air pollutant concentrations, Harrison Street, August 28, 1997
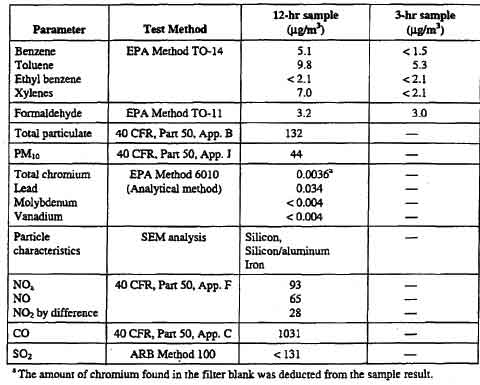
Table 3-3 Air pollutant concentrations, Harrison Street, October 17, 1997
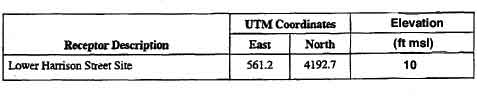
Table 4-1 Receptor description
Table 4-2 Cancer unit risk values and non-cancer reference exposure levelsSECTION 1
INTRODUCTION AND SUMMARYThe City of Berkeley, California, (City) has the option to purchase a parcel of land on lower Harrison Street, Berkeley, from the University of California. This site may become part of a park or recreation area for Berkeley citizens. The community Environmental Advisory Commission and the City staff are concerned, however, about environmental cleanliness, because this site was used, and is located in, an industrial area, involved with warehousing and manufacturing.
To address the issue of air quality, the City contracted Acurex Environmental, a Geraghty & Miller Company, to measure airborne pollutants at the site and to calculate conservative and use-specific estimates of potential health risks. Acurex identified potential ambient air pollutants at the site, collected ambient air samples on two typical days, and calculated health risks. Acurex followed California Air Resources Board (ARB) and Federal Environmental Protection Agency (EPA) testing methodologies, and computed risk factors using guidelines of the California Air Pollution Control Officers Association (CAPCOA).
In addition to normal urban air pollution, the lower Harrison Street location is exposed to local stationary and mobile sources of ambient air pollutants. The stationary sources are the City of Berkeley Solid Waste Transfer Station and the Berkeley Forge Company. Mobile sources include freight and passenger trains along the adjacent Union Pacific (UP) right-of-way, traffic on Interstate 80, and truck traffic at the transfer station. Urban street traffic contributions are accounted for as background air pollution. The pollutants of concern, potential sources, and measured pollutant levels are compared to typical urban values and standards in Table 1-1.
Risks were calculated for carcinogenic, chronic toxic, and acute toxic impacts based on two exposure scenarios. The scenarios were for the regulatory worst case assumption of continuous exposure for 70 years and for a use-specific exposure of 2 hours per day for 10 years at 240 days per year. Toxicity and carcinogenicity factors, as well as time dependent concentration adjustment factors were taken from the CAPCOA guidance manual for health risk assessment. CAPCOA factors were then adjusted appropriately to achieve the use-specific scenario. A summary of the health risk assessment results is presented in Table 1-2.
According to the CAPCOA health risk model, the maximum, use-specific exposure at the site represents an increased cancer risk of 5 cases in a population of 1 million, and hazard risk indices (chronic and acute) less than unity. These risk levels are typical of urban exposures. Furthermore, CAPCOA and ARB guidelines consider these levels to be acceptable. Based on these results, the site can be used as a playing field.
In comparison, the regulatory conservative exposure produces a maximum cancer risk of 6.7 cases in 10,000, and hazard indices exceeding unity for respiratory, kidney, and gastrointestinal/liver toxicological endpoints. These maximum health risk factors for both scenarios are dominated by the measured chromium results for the particulate samples from the October 17 test event, and by the assumption that the measured total chromium is in the highly carcinogenic, highly toxic, hexavalent chromium valence stare. Evidence from the Scanning Electron Microscopy (SEM) analysis suggests, however, that the particles contain a significant fraction of iron (i.e., rust). Thus, the source of chromium is likely to be steel that contains a small amount of low-toxicity, trivalent and zero valent chromium. With a deduction of the chromium from the risk calculation, carcinogenic, chronic toxic, and acute toxic risk are well below levels of concern.
The health risk results suggest that exposure at the lower Harrison location is no more significant than is seen in a typical, densely-populated, urban environment. Except for the small diameter particulate material, all measured values were within the normal range of values measured in the Bay Area. The small particle value, although higher than normal Bay area ranges, is below the current National Ambient Air Quality Standards (NAAQS) and below the EPA's proposed standard for these materials. Total chromium values, conservatively interpreted as hexavalent chromium, raise calculated health risk levels above usual policy "safe" levels. However, the measured chromium is most likely in particulate form, associated with iron, and is not hexavalent chromium. Thus, the risk values associated with chromium are conservatively very high.
These conclusions, however, must carry the caveat that they are base on only one day of data for each of two weather conditions, a relatively typical sunny summer day. The fall test day represented good weather conditions for the accumulation of pollutants. As the test data demonstrated, the October pollutant levels were higher. Furthermore, these results are based on the concentrations of the measured pollutants only.
This report presents the information supporting these conclusions. Section 2 presents details about the site. Section 3 covers the ambient air resting and measured results. Section 4 describes the health risk calculations. Appendices provide background information for the results.
Table 1-1. Pollutants, potential sources, concentrations, and typical urban values(a) BAAQMD August 1996 values from Oakland station for CO. Otherwise from Richmond station. Benzene, and toluene from Oakland 1991survey.
(b) lncludes both truck and locomotive engines.
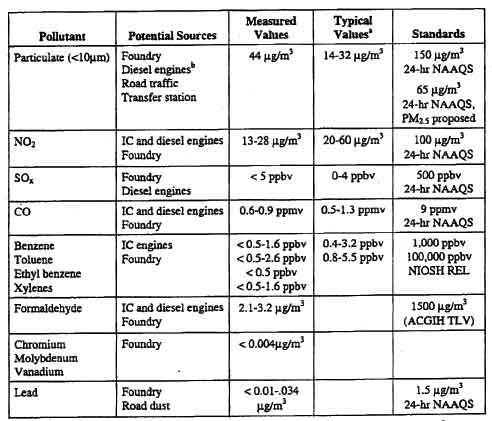
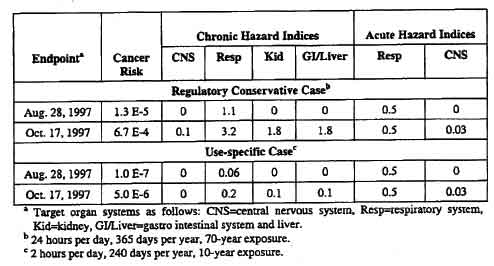
Table 1-2. Health risks for measured pollutant levels at the lower Harrison Street site
SECTION 2
SITE AND SOURCE INFORMATION2.1 SITE DESCRIPTION
The site is currently a vacant lot bounded on the east and west by 5th Street and the Union Pacific Railroad right-of-way respectively, and on the north and south by Codornices Creek and Hairison Street respectively. Most recent primary industrial use of the site was by US Steel Corportation. From the early 1920s to 1964, US Steel used the site for the manufacture and fabrication of metal products, with especially heavy metals processing during World War II. This was followed by a car dismantling and wrecking operation from about 1964 to 1971. Undeveloped portions were largely vacant until 1989, when a wood waste receiving, processing, and composting operation used a significant portion of the site until 1991. Currently, the site includes a homeless shelter, a computer rental firm, and the UC Berkeley Associated Students recycling operation.
2.2 SOURCES
Both stationary and mobile local sources contribute to the levels of pollutants in the ambient air at the lower Harrison Street location. In addition to background levels, there are six potentially significant sources of air pollution around the site; three stationary sources and three mobile sources. The stationary sources include the city of Berkeley Solid Waste Transfer Station, Pacific Steel Casting, and the Berkeley Forge Company. Mobile sources include Union Pacific (UP) freight trains and Amtrak passenger trains along the UP right-of-way, traffic along Interstate 80, and truck traffic at the transfer station. Urban street traffic contributions should not be a significant local contributor, and accounted for in the background pollutant levels.
Because of the various metal processing activities that have taken place at the site, heavy metal laden dust may be contributed to the air from the site itself. A survey of regulatory agencies elicited existing information about the quality and quantity of air emissions from only a few of the sources. Only Pacific Steel Casting and the Berkeley Forge Company had an emission inventory accessible to the public. The transfer station is exempt from hazardous air pollutant emissions inventory reporting requirements, as are mobile sources. Quality of emissions from these latter sources can be estimated from the literature. 2.2.1
2.2.1 Berkeley Forge
In the Berkeley Forge Hazardous Air Pollutants (HaPs) Emission Inventory, only benzene and formaldehyde from incomplete combustion are listed, and these in very small amounts. An earlier version of the Berkeley Forge inventory listed 1,1,1-trichloroethane (TCA), but the facility has since stopped using that compound. Berkeley forge has an air permit at Bay Area Air Quality Management District (BAAQMD) that lists emissions of carbon monoxide, nitrogen oxides, sulfur dioxide and particulate. Other potential emissions associated with steel alloy forging are heavy metals which include chromium, molybdenum, and vanadium.
2.2.2 Pacific Steel Casting Company
Of the hazardous air pollutants, Pacific Steel Casting Company reports quantities of chromium, manganese, molybdenum (trioxide), naphthalene, nickel, and phenol being emitted to the air. Based on the quantities reported, only chromium represented a potential health risk.
2.2.3 Solid Waste Transfer Station
The transfer station has an air permit on file BAAQMD for particulate emissions. There are no listed sources for HAP air emissions at the facility. This facility will have fugitive particulate emissions (primarily road dust), and mobile source emissions from heavy duty truck engines such as diesel particulate, NOx, and the fuel aromatics benzene, toluene, ethyl benzene and mixed xylenes (BTEX).
2.2.4 Freeway
Freeway-related emissions come from exhaust from a mixture of light-duty and heavyduty on-road vehicles. Light-duty vehicles (passenger cars and light trucks) are powered primarily by gasoline internal combustion engines, which emit CO, HC (including various toxic air contaminants found in gasoline, such as benzene, toluene, and xylene), NOx., and particulate matter. Heavy-duty vehicles (trucks and buses) are mainly powered by diesel engines, which emit NOx, particulate matter, and toxics, and HC and CO to a lesser extent.
Freeway emissions are a continuous, but time variable, line source. Emissions vary by time of day depending on freeway traffic volumes. Emissions of HC and CO, which are mostly emitted by light-duty vehicles, peak during am. and p.m. commute periods. NOx, and PM from heavy-duty vehicles vary mostly with truck traffic, which is more steady throughout the day.
The Eastshore Freeway (Interstate 80), which runs near the Harrison Street site, has large traffic volumes throughout the daytime hours, even during midday hours, and has significant numbers of heavy-duty vehicles, as Interstate 80 is a major trucking route. Traffic volumes on this freeway segment are expected to increase over time.
2.2.5 Railroad
Railroad emissions are a non-continuous line source. Emissions related to railroad operations along a through railroad track primarily come from locomotives, which are powered by diesel engines that emit NOx, particulate matter, and toxics, and HC and CO to a lesser extent. Where there are at-grade crossings, some emissions are also caused by on-road vehicles idling at the grade crossings while trains are passing. These emissions include CO, HC, NOx, particulate matter, and toxics.
Locomotive and idling vehicle emissions will coincide with train frequencies, and the quantity of emissions associated with each passing train will vary with the length arid weight of the train. Both freight and passenger trains operate along the Southern Pacific/Amtrak rail line, which runs near the Harrison Street site. In recent years, an average of approximately 25 freight trains per day have passed through this rail segment, (1) as well as several passenger trains per day.
Since the freight trains are much longer and heavier than the passenger trains, the freight trains represent the primary locomotive emissions source near the site. With the 1996 merger of Union Pacific and Southern Pacific, freight train frequency on this rail segment is expected to increase to approximately 32 per day in the near future. (2) Passenger train frequency may also increase in the future if Amtrak expands its "Capitol Corridor" service between the Bay Area and Sacramento.
(1) Derived from Environmental Assessment: Union Pacific Railroad Company and Southern Pacific Transportation Company Control and Merger, Surface Transportauon Board. Section of Environmental Analysis, Finance Docket 32760, Washington, D.C., April 12, 1996.
(2) ibid.
2.3 POLLUTANTS OF CONCERN
Selection of pollutants for monitoring was driven by the nature of the local sources, their reported emissions, and a general knowledge of usually found urban air toxics. Thus the criteria pollutants having primary (health based) standards and the EPA and California EPA list of hazardous air pollutants were selected for the starting list. The list of criteria pollutants with primary standards was maintained in its entirety. These pollutants include nitrogen dioxide (NO2), carbon monoxide (CO), and sulfur dioxide (SO2). Ozone was not monitored, because it is a secondary pollutant, generated in the atmosphere, and not emitted from anthropogenic sources in the local area. Ozone was considered in the background health risk calculations by using values from the nearest BAAQMD monitoring station.
The list of HAPs was pared down by reference to potential emissions from the local sources. The final list included the BTEX suite, formaldehyde, and certain heavy metals associated with iron alloys (chromium, lead, molybdenum, and vanadium). The selected. pollutants are listed in Table 1-1, along with potential local sources and measured results.
SECTION 3
AMBIENT AIR POLLUTION MEASUREMENTS3.1 TEST EVENT DESCRIPTION
3.1.1 Test ObjectiveThe overall objective of this project was to estimate potential health risks associated with exposure to air pollutants in the vicinity of the lower Harrison Street Site. Acurex conducted two test events to measure the typical concentrations of air pollutants of concern. The test events correspond to two nominal days at the Site, but the testing was not intended to represent a complete and/or statistically comprehensive quantification of the exposures that may occur. The results of the testing are presented in this section.
3.1.2 Sampling Location
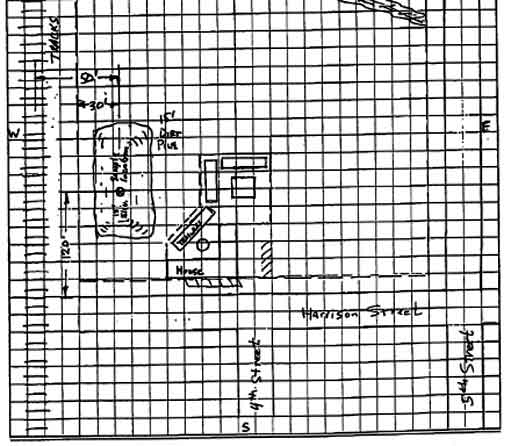
All testing was performed at the lower Harrison Street Site in Berkeley, California. As described in Section 2, the Site is bounded by the Union Pacific Railroad right-of-way to the west, Harrison Street to the south, Fifth Street to the east, and Codornices Creek to the north. A homeless shelter is located near the Site at Harrison Street where Fourth Street ends. Acurex used one of the trailers at the homeless shelter to house some of the test equipment. All samples were collected from atop a dirt mound at the southwest corner of the Site. The sampling location was approximately 50 feet from the train tracks, 120 feet from Harrison Street, 150 feet from the homeless shelter, and 15 feet above grade on the mound. Figure 3-1 is a sketch of the site layout and the sampling location.
Figure 3-1 is a sketch of the Harrison Street site, showing sampling location.
Table 3.1 Test Sampling times - lower Harrison Street site3.1.3 Test Dates and Times
Acurex conducted two test events at the Lower Harrison Site. The first test was on August 28, 1997, and the second test was on October 17, 1997. Twelve-hour samples were collected to encompass both diurnal peaks, occurring during the morning and afternoon commute periods, as well as during the mid-day period. Additional 3-hour samples were collected for benzene, toluene, ethyl benzene, xylenes (BTEX), and formaldehyde during the afternoon commute peak. The 12-hour samples were started at 6:00 a.m., on the first test day, and at 6:30 am., on the second test day. The 3-hour samples were started between 3:00 and 3:30 p.m. for both test events.
3.1.4 Test Methods
Test methods, parameters, and sampling times are shown in Table 3-1 for the two test events. All testing was performed according to EPA or ARB approved test methods. The methods are included in Appendix A. The methods are briefly described in subsections 3.1.4.1 through 3.1.4.7.
3.14.1 BTU (EPA Method TO-14)
Benzene, toluene, ethyl benzene, and xylenes (BTEX) were collected and analyzed using 6-liter (6 L) Surnma® canisters, according to EPA Method TO-14. In this method, the vacuum of the canisters pulls the ambient air through a critical orifice to collect an integrated average sample over the desired sampling period. The vacuum of each canister is checked before and after the sampling run to determine whether sufficient vacuum was present to ensure that the sample was drawn throughout the desired testing period. Per the method, the samples collected in each test event were analyzed by gas chromatography/mass spectrometry (GC/MS). One 12 hour sample and one 3-hour (peak commute) sample were collected for each rest event.
3.1.4.2 Formaldehyde (EPA Method TO-11)
Formaldehyde samples were collected and analyzed using cartridges coated with acidified dinitrophenyihydrazine (DNPH), according to EPA Method TO-11. One 12-hour and one 3-hour sample were collected for each test event. In Method TO11 sampling and analysis, the samples are collected through the acidified DNPH-coated cartridges at a sample rate of approximately 1200 milliliters per minute (mL/min). For the 12-hour sampling conducted in this test program, Acurex placed two DNPH cartridges in series. Per the method, the cartridges were analyzed by high-performance liquid chromatography (HPLC).
3.1.4.3 Total Suspended Particulate Matter
Total suspended particulate matter (TSP) was measured according to 40 CFR 50, Appendix B (High-Volume Method). In TSP sampling and analysis, a calibrated high-volume air sampler is used to collect a measured quantity of ambient through a filter during a 12-hour sampling period. The collected particulate mass is determined gravimetrically by subtracting the pre-test weight of the paper filter from the post-test weight.
3.1.4.4 PM10
For the second sampling event, Acuxrex measured the concentration of particulate matter with an aerodynamic diameter less than or equal to 10 micrometers (PM10) according to the method in 40 CFR 50, Appendix J. In this method, a calibrated air sampling pump is used to draw air at a constant flowrate of 20 liters per minute (Lpm) through a pre-weighed filter mounted in a PM10 impacror assembly. The air sampling pump is calibrated before and after sampling to ensure the accuracy of the sampling rate. At this flowrate, the impacror is designed to exclude particles larger than PM10 The collected particulate mass is determined gravimetrically.
3.1.4.5 Metals (EPA Method 6010)
The investigation described in Section 2 indicated that the suspended particulate matter at the site may contain certain toxic metal compounds, including chromium, lead, molybdenum, and vanadium. After completing the post-test, high volume filter weighings, Acurex analyzed the samples according to EPA Method 6010B to determine the amounts of these metals present. Specifically, the filters were chemically digested and analyzed by inductively coupled plasma atomic emission spectrometry (ICP-AES). For both test events, the filter was split before analysis so the SEM analysis, described below, could be performed.
3.1.4.6 Scanning Electron Microscopy
Computer-controlled scanning electron microscopy (SEM) was used to obtain information on the size, number distribution, and chemical composition of the suspended particle samples taken during the second test event. The two filter samples were sonicated in water and redeposited onto a polycarbonate filter. During each SEM analysis, 600 particles were randomly analyzed at a magnification of l000x. SEM analysis provides simultaneous measurement of particle size, shape, and elemental composition.
3.1.4.7 Criteria Pollutant Gases
The concentrations of criteria pollutant gases (CO. SO2, NOx) were measured using continuous ambient air analyzers. The analyzers were housed in a trailer at the homeless shelter near the Lower Harrison Site for both test events. Ambient air was pulled approximately 150 feet from the sampling location to the trailer through a 1/2-inch Poly (TM) tube. The sampling System was leak-checked before sampling, and the analyzers were calibrated before and after testing. Signals from the analyzers were continuously recorded using a data acquisition system.
NOx and NO concentrations were measured with a chemiluminescence analyzer according to 40 CM 50, Appendix F. NO2 was determined as the difference between the NO, and NO results. CO concentrations were measured with a non-dispersive infrared (NDIR) analyzer according to 40 CFR 50, Appendix C. SO2 concentrations were measured with a fluorescence analyzer according to ARB Method 100.
3.2 METEOROLOGICAL CONDITIONS
Weather conditions during the two test periods fell within the seasonal norms. During the test event on August 28, 1997, winds were light and steady from the west during the day, slowly increasing in velocity from less than 1 mph, around 6 am., to 20 mph, at 4:00 p.m. The sky was clear, with humidity ranging between 90 percent, in the early morning, to 72 percent, at 4:00 p.m. The barometric pressure was falling from a high of 30.07 inches Hg, at 11:00 a.m., to a low of 28.98 inches Hg, at 7:00 p.m. The air temperature reached a high of 72°F, at 4:00 p.m.
For the rest event on October 17, 1997, the day began overcast with thick fog, clearing around 10:00 a.m. Winds were transitional, ranging from less than 1 mph to 11 mph, and came from variable directions. Temperatures ranged from 57°F, at 8:00 a.m., to 76°F, at 5:00 p.m. Humidity ranged from 96 percent, at 8:00 a.m., to 50 percent, at 5:00 p.m. Barometric pressure ranged from 30.05 to 29.96 inches Hg.
The second test day was typical of meteorology that is conductive to the fround-level buildup of pollutants. The August testing was on a typical sunny summer day, and the October testing was on a relatively calm fall day. Of the two days, the October meteorology would produce the worst pollution because of the lower winds and higher afternoon temperatures. These conditions often create a thermal inversion that traps pollutants near the ground level. However, no information was available to indicate whether an afternoon inversion was present.
3.3 AMBIENT AIR POLLUTION CONCENTRATIONS
The measured concentrations of ambient air pollutants at the lower Harrison Street Site are listed for the two rest dates in Tables 3-2 and 3-3, respectively. Results are discussed in the following subsections.
Table 3-2. Air pollutant concentrations, Harrison Street, August 28, 1997
Table 3.3 Air Pollutants concentrations, Harrrison Street, October 17, 19973.4 FORMALDEHYDE RESULTS
Data quality indicators for formaldehyde analyses were within method parameters. Results were at least 5 times detection limit, and blanks were below the detection limits. Acurex used an additional DNPH cartridge placed in series with the first cartridge for the 12-hour sample. The formaldehyde breakthrough to the second cartridges was a small fraction of the total sample.
3.5 TOTAL PARTICULATE AND PM10, RESULTS
Data quality for particulate measurements is ensured by calibrating the sampling flow and filter weight measurement equipment. Calibration records are included in Appendix A.
The October test event included testing for both total particulate matter and PM10. The PM10 was found to be only 33 percent of the total particulate matter.
3.6 METALS RESULTS
After the particulate measurements of filter samples were complete, the filters were sent for analysis of to determine the amounts of total chromium, lead, molybdenum, and vanadium. This procedure is not covered by an approved. method,but was performed to generate reference information. Molybdenum, and vanadium were not detected, arid lead was detected only in the October sample.
The analytical laboratory also reported total chromium for both test events. However, for each event, both the filter samples and filter field blanks contained total chromium. Acurex submitted a separate, unused (new) filter from the same batch to determine if the filter field blank results were due to laboratory contamination or bias. No chromium was detected in the new filter. The chromium levels measured in both test events are attributable, at least in part to contamination. The contamination may have occurred, for example, in the particle weighing procedure.
Under the assumption that contamination is consistent for all samples in a test event., Acurex deducted the amount in the field filter blank from the test sample. For the August event, this deduction reduced the amount of total chromium reported to zero (Not detected [ND]). For the October test event, the filter field blank correction was 36 percent of the sample result. Total chromium reported for the October test event is, therefore, 64 percent of the measured value.
Even without blank correction, the total chromium results represent less than 0.005 percent by weight of the total particulate matter. Inaddition, ambient particulate chromium is primarily trivalent chromium, probably assoicated with iron. Therefore, using the total chromium number as a hexavalent number is conservative.
3.7 SEM RESULTS
The SEM analysis of a portion of the October particulate sample provided information on the composition of the majority of the particle catch. See Table 3-3. The silicon and silicon aluminum in the particles are most likely earth crusral material (i.e., dirt). The iron is most likely from rust.
3.8 CONTINUOUS ANALYZER RESULTS FOR CRITERIA POLLUTANT GASES
NOx, CO, and SO2 were measured with continuous analyzers. Instruments are calibrated before and after the sampling period in the range of measured results. Calibration records are appended. The NOx analyzer has a flow option that enables analysis for only NO or for all oxides of nitrogen (i.e., NOx). Acurex collected data in both modes and took the difference to determine ambient air concentration of NO2. Average results from the 12-hour data collection period are used in the risk calculations.
The continuous analyzers identified an impact on the air quality each time a freight or passenger train passed the site. For a few minutes after a train has passed the site, NOx increases by a factor of 4 and NO increases by a factor of 3. Despite the momentary peak, levels do not reach levels of regulatory concern.
SECTION 4 HEALTH RISK CALCULATIONS
This section presents the health risk calculations for the pollutant compounds present in the ambient air at the lower Harrison Street Site. Section 4.1 identifies the location for the risk calculation. Section 4.2 details the health risk calculations and procedures Section 4.3 discusses the hazard and exposure results.
4.1 RECEPTOR LOCATION
The health risk calculation was conducted for the single ambient air test location at the Site. The UTM coordinates for the test location are shown in Table 4-1.
Table 4.1 Receptor description
4.2 HEALTH RISK ASSESSMENT PROCEDURE
Acurex computed health risk factors, in accordance with CAPCOA guidelines (References 1 and 2), using measured concentrations of suspected ambient air pollutants at the lower Harrison Street Site. The ambient sampling techniques, calculations, and test results are described in Section 3 of this report The health risks for seven compounds detected in the ambient air were evaluated: benzene, toluene, xylenes, formaldehyde, lead, chromium, and NO2. In addition, background ozone concentrations were included in the risk calculation based on data reported by the BAAQMD (Reference 3).
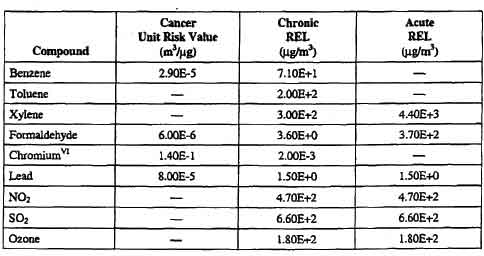
Compounds were selected for inclusion in the health risk (1.) if they were on the CAPCOA list of compounds of concern (Table III-2 to III-7 of the CAPCOA Manual); (2) if there was an unidentified source of the pollutants; and (3) if they were found to be present in the ambient air at the lower Harrison Site. The cancer unit risk values (URV) and the chronic and acute reference exposure levels (RELs) for the compounds of interest are listed in Table 4-2. The URVs and RELs were taken from Tables III-6, III-8, and III-9 of the CAPCOA Risk Assessment Guidelines (Reference 1). These values correspond to the conservative regulatory receptor scenario of continuous resident exposure at the site. Cancer risks are for an exposure period of 70 years; chronic risks are for a 1-year exposure; and acute risks are for a 1-hour exposure.
Table 4-2. Cancer unit risk values and non-cancer reference exposure levels
The scope of this evaluation was limited to health risks associated with ambient air pollution. Inhalation exposure is, therefore, the only pathway that was considered. Furthermore,the primary receptor scenario of concern was for a use-specific exposure by a non-resident receptor. The conservative regulatory exposure scenario for carcinogenic risk is based on a lifetime exposure of 24 hours per day, 365 days per year for 70 years. Use-specific risk is based on a park visitor exposure of 2 hours per day, 240 days per year for 10 years.
Exposure through inhalation occurs with all compounds considered; however, only four pose cancer risks: benzene, formaldehyde, bexavalent chromium, and lead. Nine compounds are listed as non-carcinogenic, chronic hazards. Six compounds can be considered acute hazards at high concentrations.
The cancer risks of benzene, formaldehyde, hexavalent chromium, and lead were determined as outlined in the CAPCOA Risk Assessment Guidelines. To calculate the cancer risk, the annual average concentration at each receptor is multiplied by the cancer potency value. This yields an individual cancer risk probability. The use-specific carcinogenic risk is determined by adjusting the residential risk for the shorter time spent at the location. The measured ambient air 12-hour average concentration is used as a conservative estimate of the annual average concentration. Ozone ambient air concentrations used in the analysis are based on BAAQMD 1-hour maximum background concentrations for the Richmond Station on August 1996.
For each compound, a chronic hazard index was determined by dividing the annual average concentration by the reference exposure level. The total chronic hazard index is the sum of the chronic hazard indices of all compounds for each toxicological endpoint. If the total chronic hazard index for any toxicological endpoint is greater than or equal to one, a potential level of concern exists.
Acute hazard indices were calculated in the same way as the chronic compounds; however, the maximum one-hour concentration is used instead of the annual average concentration. CAPCOA provides that the 1-hour maximum concentrations can be estimated by applying a multiplying factor of 1.43 to the 12-hour average concentration. As with the chronic hazards, a total acute hazard index at any toxicological endpoint greater than or equal to one defines a potential level of concern.
Currently, there are no acute reference exposure levels for lead. The REL is based on exposure over a 30-day period. CAPCOA suggests that a 30-day averaging time be used to estimate the lead exposure to determine a hazard index representing a sub-chronic exposure. However, the lead concentrations determined during the ambient source tests are based on a 12-hour average, overestimating individual exposures and resulting in conservative estimates of health impacts due to lead.
4-3 RISK AND EXPOSURE RESULTS
Appendix B contains the exposure values and health risk results. It also provides toxicity information for selected pollutants. According to ARB guidelines, any cancer risk less than one in one million is clearly acceptable. The regulatory concern intensifies when the potential cancer risk is greater than or equal 1 in 100,000 or either health hazard index (acute or chronic) is greater than or equal to 1.0.
4.3.1 Acute Exposure Hazards
Xylenes, formaldehyde, NO2, SO2, and ozone are known to cause acute non-cancer health effects of the respiratory system. The total acute hazard index for these compounds is less that one, indicating that the ambient air concentrations at the lower Harrison Street Site should not cause acute adverse health effects. Lead may also cause acute non-cancer health effects to the central nervous system (CNS). However, the lead acute hazard index for CNS is well below 1, indicating that lead compound should not adversely affect public health.
4.3.2 Chronic Exposure Hazards
For the consertivative regulatory exposure scenario, the respiratory hazard index is greater than 1 for both test days, indicating that the ambient air concentrations at the lower Hamson Street Site could produce chronic, adverse non-cancer health effects ffrom longterm exposure. However, the use-specific chronic respiratory hazard indices are well below 1, indicating that the ambient air pollutant concentrations at the lower Harrison Site would not result in chronic, adverse non-cancer health effects for the anticipated exposure of future users of the site, if it were a park or recreational facility.
For the regulatory conservative exposure, chromium also causes the chronic hazard index for kidney, gastrointestinal and liver damage to exceed unity on the second test day. This hazard index result occurs because the analysis uses the conservative assumption that all chromium in the rest results is hexavalenc, even though the probable chromium source (rust) contains only trivalent chromium.. The use-specific scenario is well below unity even with the chromium included as hexavalent.
43.3 Cancer Risk
The highest cancer risk, based on the regulatory conservative exposure scenario, is 67 cases in a population of 100,000. For the use-specific case, the cancer risk is 5.3 cases in 1 million. These estimates correspond to the unrealistic assumption of hexavalent chromium exposure.
Without consideration of chromium, the ambient air concentrations of benzene, formaldehyde, and lead pose a carcinogenic risk of 17 cases in 100,000, again for the regulatory conservative exposure scenario. For the use-specific scenario, the maximum cancer risk is less than 1.4 cases in 1 million.
REFERENCES
1. Air Toxics Assessment Manual, California Air Pollution Control Oficers Associations (CAPCOA), revised 1989
2. Air Toxics "Hot Spots" Program Risk Assessment Guidelaines, October 1993
3. BAAQMD Contaminant Weather Summary, Bay Area Air Quality Management District (BAAQMD), August 1996
All Rights Reserved