Air Quality Evaluation and
Recommended Mitigation Measures
BERKELEY TRANSFER STATION
Air Quality Evaluation and Recommended Mitigation Measures
ESA Environmental Science Associates, April 29, 2003 City of Berkeley Public Works Department
Berkeley, California 94704
| TABLE OF CONTENTS | ||
| AIR QUALITY EVALUATION AND RECOMMENDED MITIGATION MEASURES | Page | |
| I. INTRODUCTION | 1-1 | |
| I-I | ||
| II. FINDINGS | II-I | |
Review of Previous Studies |
II-I II-4 II-5 II-6 |
|
| III. ADDITIONAL CONTROL MEASURES | 111-1 | |
Operational Controls |
III-I III-5 III-8 |
|
| IV. CONCLUSIONS AND RECOMMENDATIONS | IV-1 | |
LIST OF FIGURE |
||
1 |
Project Location Diurnal Pattern Over Entire Study Period, Harrison Park Monitor PM 10 Sources at Worst-Case Offsite Location Dust is generated when loads are emptied Greenwaste does not generate visible dust Hanging Baffle System Wind Break Fence(s) Building Enclosures |
1-3 |
TABLE |
|
|
4-1 |
Estimate of Control Measure Effectiveness | IV-2 |
TABLE 4-1 Estimate of Control Measure Effectiveness
I. INTRODUCTION
The City of Berkeley has retained Environmental Science Associates (ESA) to:• review recent studies of air quality near the Berkeley Transfer Station; in the context of determining potential future air quality mitigation measures;
• review the appropriateness of air quality mitigation measures already implemented at the Berkeley Transfer Station; and
• recommend other measures at the Berkeley Transfer Station that could further improve air quality at the transfer station and in the vicinity of the transfer station.Chapter 2 of this report reviews the methodologies and conclusions of recent air quality studies that have been conducted near the Berkeley Transfer Station. Chapter 2 also analyzes the effectiveness of the levels of respirable particulate matter (PM10) (dust) 1 control measures that were installed in 2002 and 2003. Additional control measures are presented in Chapter 3 and analyzed for their potential to further reduce PM10 generated by operations at the transfer station. Chapter 4 presents conclusions and recommendations about the previous air quality assessments and dust control mitigations.
1. PM 10is respirable particulate matter with aerometric diameter of equal to or less than 10 microns. It is a recognized air pollutant and is essentially: "fine dust particles." Typical dust will contain particles greater than 10 microns and less than 10 microns. This report will use the terms dust and PM 10relatively interchangeably. This report will clearly identify
measurements of PM 10 as being PM 10 because that is all that is collected in the measurements. When referring to mitigation measures for PM10 the report will often refer to dust mitigations -- since reducing the dust will reduce the PM 10.An annotated aerial photo of the Berkeley Transfer Station and the surrounding areas to the east are shown in Figure 1. As can be seen in Figure 1, the Transfer Station is just east of Interstate 80 in an industrial area of Berkeley north of Gilman Street. Figure 1 does not show the additional industries in this area that are located just south of Gilman Street.
There are two land uses just east of the Berkeley Transfer station that are sensitive to air quality. These uses are the Harrison Field soccer field and the Ursula Sherman Village (USV). Air quality measurements conducted to determine the PM10 at the soccer field began in 2001. These measurements indicated that dust from the transfer station is contributing to air quality levels downwind that frequently exceed the state standard for PM 10. As noted above, the Berkeley Transfer Station has already implemented mitigation measures intended to reduce PM10 at the transfer station and downwind of the transfer station at the soccer field and at Ursula Sherman Village.
The Berkeley Transfer Station is not in violation of any known air quality regulations, but intends to continue implementing measures that will improve air quality in a cost efficient manner. Measures already implemented include the use of B 100 biodiesel fuel to reduce emissions from diesel engines that the City operates, adding new route trucks that are fueled by compressed natural gas (CNG), addition of a misting system to "wet" dust on-site, installation of a perimeter fence to the east of the transfer station that will be covered with vines (to block the pathway of PM10 leaving the site), and adding trees to reduce on-site winds and the transport of dust.
ESA's overall assessment of the transfer station indicates that the transfer station has already implemented three important proactive air quality measures that are very common among modern transfer stations: (1) the high-pressure mist system to reduce dust in the tipping area, (2) the use of B100 biodiesel fuel for diesel engines, and (3) new route trucks that are fueled with CNG. In Chapter 4 ESA recommends several measures that could further reduce dust levels on-site and off-site.
It can be concluded that, although the transfer station certainly contributes to ambient PM10 concentrations at the soccer field and the USV site, the magnitude of the contribution would be smaller than levels reported at the monitor PM10 station, under the same conditions. This is because the PM10 monitoring location was selected at the worst-case location, and dispersion modeling described in this report indicates PM10 concentrations would fall rapidly at greater distances.
II. FINDINGS
REVIEW OF PREVIOUS STUDIESESA has reviewed the two reports prepared by Environ for BOSS (Building Opportunities for SelfSufficiency) that address air quality at the proposed site of USV:
- Final Report on Air Quality at the Proposed Site of the Ursula Sherman Village, March 15, 2002. ENVIRON International Corporation
- Update on Air Quality at the Proposed Site of the Ursula Sherman Village, September 30, 2002. ENVIRON International Corporation
These studies reported the results of analyses of PM10 and PM2.52 ambient air measurements collected at a location that is generally downwind of Berkeley Transfer Station. Applied Measurement Science, a company that was under contract with the City of Berkeley, collected the PM10 and PM2.5 data.
ESA has also reviewed the following two Draft reports prepared by Applied Measurement Science.
- PM10/PM2.5 Monitoring at Harrison Park, Berkeley, California, March 20, 2003
- PM/10 Monitoring at the Berkeley Recycling Center Materials Recovery Facility July, 2002 to January, 2003, March 14, 2003
The most obvious conclusions from these reports are the following:
• PM2.5 levels do not appear to correlate to the operating hours of the transfer station and have been dismissed by both the Environ study and Dr. Weinegar as not being a major effect of transfer station operations. PM2.5 will not be further discussed, for the most part, in the remainder of this report. ESA's additional research has found that the City's use of B 100 biodiesel fuel at the transfer station should already be reducing the PM10 emissions from diesel engine use by approximately 50 percent. B 100 fuel also reduces carbon monoxide emissions by 50 percent and hydrocarbon emissions by more than 50 percent. 3
• Background PM10 levels in this area (meaning the 1/4 mile area that surrounds the Berkeley Transfer Station) are as high as 39 micrograms per cubic meter (ug/m3). Dr. Weinegar identified the following long-term averages from his report (4):
These averages were determined in most cases from thousands of hourly data points. The measurement equipment was tested by the Bay Area Air Quality Management District (BAAQMD) audit team and was found to be operating properly.
Dr. Weinegar's report further indicates:
"The value of 39 ug/m3 can be considered an upper bound to the background level at Harrison Park. It is considered an upper bound because the Park is a couple hundred yards from the recycling center and the other sources and therefore that background level would be diminished somewhat by the distance from the recycling center to the monitoring site at the park. Therefore, the value of 39 ug/m3 is considered as a background concentration to Harrison Park. This relatively high background level shows the impact of the highways and industrial sources in the area, which will be further considered in the section comparing Harrison Park data to other monitoring sites in the Bay Area."
• The PM10 levels measured in these reports are not directly comparable to other Bay Area regional measurements (collected by the Bay Area Air Quality Management District [BAAQMD]) because the BAAQMD does not measure directly downwind of minor sources.
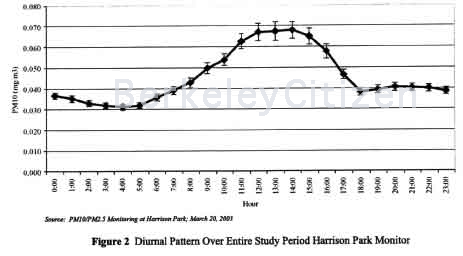
• The effect on PM 10 concentrations from the Berkeley Transfer Station can best be understood by a plot of the hourly data over the length of the monitoring efforts. The average hourly plot for the Harrison Park PM 10 monitor is shown in Figures 2 and 3. They clearly show the background level of approximately 40 ug/m3 in the hours when the transfer station is normally closed and show an increase of about 30 ug/m3 (resulting in total concentrations of up to 68 ug/m3) during the hours when the transfer station is operating. ESA has reviewed all the background reports identified above and believes this increased PM 10 burden during transfer station operating hours is the result of transfer station operations. Figure 3 shows an overview of the sources of the PM 10. The Bay Area background is approximately 20 ug/m3. Added to that is a local West Berkeley background component of approximately 10 to 20 ug/m3. Finally, on top of both, the PM 10 from the Berkeley Transfer Station is added to Bay Area regional and local West Berkeley background PM 10 concentrations. As described under the dispersion modeling write-up below, the PM10 measured for the transfer station was measured at a worst-case offsite location.
• The California state PM 10 24-hour standard of 50 ug/m3 is violated regularly throughout the state (even when measured at representative neighborhood locations that are not directly downwind of a transfer station or other industrial source of dust). The federal 24-hour standard (150 ug/m3) is three times higher than the state standard and was not violated in any of the PM10 measurements.Source: PM 10/PM 2.5 Monitoring at Harrison Park; March 20. 2003
Figure 2 Diurnal Pattern Over Entire Study Period Harrison Park MonitorSource: PM 10/PM 2.5 Monitoring at Harrison Park: March 20. 2003; and Environmental Science Associates
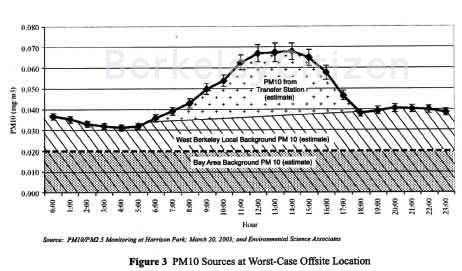
Figure 3 PM 10 Sources at Worst-Case Offsite Location
No specific standard exists for worker exposures to dust generated from transfer stations. However, a general category of "particulates not otherwise regulated" exists to handle this kind of situation. The OSHA permissible exposure level (PEL) for particulates otherwise not regulated is 15 mg/m3 (15,000 ug/m3 for total dust) and 5 mg/m3 (5,000 ug/m3) for respirable dust (generally the same as PM 10). The prior reports on this data have pointed out the Los Angeles area has higher PM 10 levels than what has been measured at Harrison Park. 5
"Six-month average PM10 concentrations in and around Los Angeles were generally higher than those measured at Bay Area sites or at the soccer field. As expected, concentrations at most Los Angeles monitors were highest during the winter months, when the reported peak concentrations tended to occur. As was the case in the Bay Area, peak 24-hour average PM10 concentrations varied quite a bit between different Los Angeles monitoring sites. Many of these peaks [in Los Angeles] were higher than the peak 24-hour PM10 concentration measured at the soccer field (86.3 ug/m3). The highest 24-hour average PM10 concentration measured in the Los Angeles (166 ug/m3 in Ontario) was nearly twice as high as the peak 24-hour soccer field concentration."
ADDITIONAL MICROSCALE CONSIDERATIONS
Environ based part of its Final Report conclusions on the impacts of PM 10 sources on the USV site, based on a highway monitoring study. The report states:
The application of the results in an article describing the results of a PM 10 monitoring study conducted in St. Louis, Missouri in 1999, however, suggests that PM 10 impacts on the West Berkeley area due to the freeway are probably limited. According to this report, downwind PM 10 concentrations measured at several locations near freeways showed linear decreases with increasing distance from the freeway. At each location, PM 10 concentrations measured downwind of the freeway dropped off to match upwind levels at a distance of 70 meters (230 feet) from the freeway.(6) As the proposed Ursula Sherman Village would be more than 700 feet from the freeway, if the results of the St. Louis study hold in West Berkeley, it is unlikely that the freeway results in increased particulate concentrations at the proposed USV.
ESA believes this same argument can hold with regard to the Transfer Station, since the PM 10 monitor is less than 70 meters away from the Transfer Station, but most areas of the soccer field and the USV project site are greater than 70 meters from the Transfer Station. One could conclude that the actual PM 10 concentrations at most areas of USV and the soccer field would be lower than the levels reported in the Environ reports. Applied Measurement Science described the placement of the PM10 monitor as follows:
"The specific monitoring location at the park was selected on the basis of several criteria. First, a worse case location--e.g., a location close to the western side of the park--was selected so that there would be a built- in conservatism in all data collected."
A screening modeling analysis was conducted by ESA using the EPA dispersion model SCREEN3 to confirm these assumptions and to track predicted PM10 ambient air concentrations as a function of downwind distance from the Transfer Station. The Transfer Station was assumed to be a square area emission source approximately 30 meters on a side. Unit emissions were assumed for the source. The model predicted downwind ambient air concentrations at the soccer field and at the USV location, relative to concentrations that would occur at the monitor location. Typical daytime neutral atmospheric stability with wind speeds of 3 meters per second (6.5 mph) were assumed in the model.
The predicted levels at the soccer field (a distance of 120 meters from the east doors of the transfer station) were about one third the levels predicted at the monitor location, and levels at the USV location (a distance of 100 meters from the east doors of the transfer station) were about one half the levels at the monitor location. As stated above, the monitor location was assumed to be about 60 meters from the Transfer Station building in the screening modeling analysis, while the soccer field was assumed to be about 120 meters away with the USV site being about 100 meters away. Thus, on days when PM 10 concentrations were measured at the Harrison Park monitor, corresponding levels (associated with the component of the PM 10 that came from the Transfer Station) at the soccer field and at the proposed USV site would be lower than levels reported for the monitor location.
It can be concluded that, although the transfer station certainly contributes to ambient PM 10 concentrations at the soccer field and the USV site, the magnitude of the contribution would be smaller than levels reported at the monitor PM 10 station, under the same conditions.
An example based on Figure 3 is probably helpful:
Site 1 (Distance 60 meters from transfer station). At the Harrison Park PM 10 monitor (60 meters downwind from the transfer station) the PM 10 concentration averaged 68 ug/m3 at 13:00 hours. This is made up of a local background concentration of approximately 40 ug/m3 and a local source contribution (the Berkeley Transfer Station) of 28 ug/m3. The total is 40+ 28 =68 ug/m3
Site 2 (Distance 100 meters from transfer station). Based on the results of the dispersion modeling, at a distance of 100 meters from the transfer station (such as USV locations) the concentration for this same hour would be predicted to be about 54 ug/m3. This still includes the local background concentration of approximately 40 ug/m3 but only one half of the local source concentration (Berkeley Transfer Station), or about 14 ug/m3. The total is 40+ 14=54 ug/m3
Not withstanding this information, PM 10 concentrations could be lowered at the USV site, if the Transfer Station adopts additional mitigation measures (See Chapter 3). Theoretically the levels at USV could be reduced to the background average level of about 40 ug/m3, but no actions at the transfer station could lower the average levels below 40 ug/m3, which is the local background PM 10 concentration. In addition, the USV building could be designed to efficiently filter indoor air, which would improve indoor air quality regardless of the source of the PM 10 (i.e., regional, the Transfer Station, Interstate 80, other industrial operations).
ESA staff made several Transfer Station site inspections to review operations and make observations. We initially expected to see the predominant southeast winds whipping though the building and generating clouds of dust that would be transported to the east. We did not observe this, and actually we now believe the wind to be less of factor in dispersing the dust than was previously thought. We do believe the wind can help transport dust to the east, but the consistency of the daily PM 10 cycles (at the measurement location) does not seem dependent on the daily winds. The energy from the handling of the waste materials and the configuration of the building may be all that is necessary to move dust out of the building to the nearby PM 10 monitor.
TRANSFER STATION DUST: (MAJOR DUST SOURCE)
The energy that stirs up the dust comes from (1) dropping dusty materials out of the public and City trucks onto the floor of the transfer station [see Figure 4] (2) the wheeled loader picking up the materials and (3) the wheeled loader pushing the loads into the top of the transfer trucks. Each of these actions creates a visible dust plume with most loads, and this energy along is probably enough to expel PM 10 from the building (via the openings in the transfer station building).
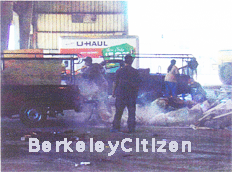 |
| Figure 4. Dust is generated when loads are emptied |
GREENWASTE HANDLING DUST (MINOR SOURCE)
Observations at the Transfer Station indicated that the handling of greenwaste is not a major generator of dust [see Figure 5]. Some dust is generated by the unloading of greenwaste and indirectly, greenwaste load will cause dust because of the re-entrainment of dust caused by the vehicles delivering greenwaste to the transfer station.
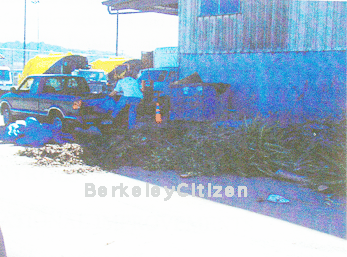 |
| Figure 5. Greenwaste does not generate visible dust. |
VEHICLE DUST RE-ENTRAINMENT (MEDIUM DUST SOURCE)
Vehicles traveling on all roads re-entrain dust that has settled on the road. The dust on the pavement at the transfer station is constantly being stirred up by vehicles on the site. This creates energy to move PM 10 from the site, with or without the help of the wind.
DIESEL EMISSIONS (MINOR SOURCE)
The wheeled loader belches black diesel exhaust frequently during operations. Diesel exhaust is also generated by the fleet vehicles when unloading, parking, or moving about on the site. Site observations indicate that diesel vehicles are only operated when necessary, and the entire fleet is using B 100 biodiesel fuel that reduces emissions. Since diesel exhaust is primarily PM2.5, the lack of any PM 2.5 spikes at the Harrison Park monitoring station indicates that diesel exhaust from the Berkeley Transfer Station is not a major factor to the neighboring land uses. The effects of diesel exhaust are probably more of an issue for the on-site workers and the general population of Berkeley (since the fleet trucks travel throughout the City and do bum considerable amounts of fuel).
CHAPTER 3 ADDITIONAL CONTROL MEASURES
A range of possible control measures are available to reduce both the quantity of dust and PM 10 emissions generated by transfer station activities, and the potential for PM 10 emissions to reach the soccer field and the USV project site. Possible control measures include changes to the operation of the transfer station and the addition of architectural features to the transfer station facility. Estimated costs are provided and discussed for those measures that involve the purchase of additional equipment. Potential control measures vary in both effectiveness and cost, and often more than one suggestion is included to address an issue.
OPERATIONAL CONTROLS MIST SYSTEM OPERATIONAL IMPROVEMENTS
Observations and discussions with operations staff at the transfer station suggest that the mist system needs to be fine tuned in order to make it more effective. Wind often redirects mist that is emerging from the mist nozzles. The following innovations would help ensure that mist system works as planned:
- Repair the skylights. This is discussed in more detail below, but is a critical first step in [me-tuning the mist system. These repairs have been identified by the transfer station for some time, and should be made a priority to assist in the proper functioning of the high-pressure mist system.
- In order to prevent wind from redirecting mist as it sprays out of the mist nozzles, baffles could be mounted to the ceiling between the mist nozzles, as shown in Figure 6. A series of "banner-like" vertical baffles made of durable, non-corrosive, nonflammable material would be hung in an "egg crate pattern" so that the bottoms are approximately four feet below the misting nozzles (Note: compliance with fire codes may reduce the distance the baffles can hang below the misting nozzles -- perhaps reducing the effectiveness of this mitigation measure). The baffles would interrupt some of the wind allowing more of the mist to fall downward, though wind may continue to redirect mist as soon as it falls below the baffles. Estimated cost: $25,000 - $35,000
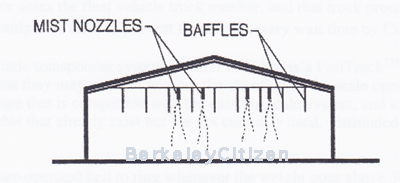 |
| Figure 6. Hanging Baffle system |
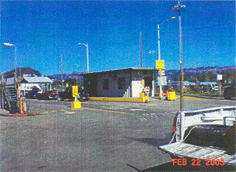 |
| Customers waiting to weigh out and pay at the outbound scale |
QUEUE AT SCALES
Reducing the length of time vehicles spend at the transfer station will result in a reduction of tailpipe emissions on the site. The total time spent at the facility by both City collection trucks and private vehicles is largely dependent on the speed of transaction processing at the scale house. A well-managed scale house typically can handle the weighing of a customer and collect payment in less than one minute. Observations at the Berkeley facility, however, show that most outbound customers require between one and two minutes, if not longer, and the average departure line at the public outbound scale was observed to be five to eight vehicles long during a busy period in a typical day.Three vehicle scales are located in the entrance/exit area. One scale is used only by the City fleet for weighing in. The other two scales are used by public customers - one for weighing in and the other for weighing out. Most vehicles arriving at the transfer station first weigh in at the scale house, proceed to their unloading area in the transfer station, unload, and then return to the scale house to weigh out. Most customers, except those with "minimum loads," make payment at the outbound scale.
The following measures pertain to operation of the outbound public scale and aim to reduce the length of time spent by vehicles at the facility:
• The facility should no longer accept payment from departing vehicles by check. Check payment by public customers typically takes longer than two minutes at the outbound public scale, which contributes to extensive queuing. Signs indicating acceptable payment methods should be posted at the entrance. The arrangement of lanes at the scale house is such that outbound public trucks can block the scale operator's ability to see inbound fleet vehicles waiting to weigh in. The arrangement of the three scales is shown in Figure 1. When the outbound lane is busy, which is common, fleet trucks often wait for one to two minutes until the scale operator completes a transaction with a customer at the outbound public scale. Then the scale operator notes the fleet vehicle truck number, and that truck proceeds to the unloading area. The following mitigation aims to prevent this unnecessary wait time by City fleet vehicles:
• Install an electronic transponder system (similar to Caltrans's FastTrack™ system) to log City fleet vehicles in so that they may proceed without the attention of the scale operator. It will be necessary to install hardware that is compatible with the existing scale system, and to link the scale computer to the traffic lights that already exist but are not currently used. Estimated Cost: approximately $36,000.
• Install a computer-operated bell to ring whenever the weight goes above 500 pounds on the City fleet scale. Estimated Cost: $2,000
• Install a wireless doorbell-type bell for City fleet drivers to notify scale operators of their presence when they are otherwise unnoticed. Estimated Cost: $200 (maximum)
The initial cost of installing a computer operated bell or a doorbell-type bell would be considerably lower than implementing an electronic transponder system. The scale house is often, but not always, staffed by two people. When there is just one operator, the transponder would definitely save them time.PARTICULATE EMISSION CONTROL ON THE MAIN LOADER
Particulate matter and other air emissions are generated by operation of the John Deere wheeled loader that uses B 100 biodiesel fuel. This fuel should already have reduced PM 10 up to 50 percent. Further reductions, if any are possible, should be coordinated with John Deere. Preliminary discussions indicate that John Deere does not have much data on this engine using B 1 00 fuel. Addition of a catalytic trap may further reduce particulates, however this is unknown now. If low sulfur diesel fuel were used, particulates would be reduced from regular diesel fuel and a catalytic trap would reduce particulates further.
However, there are two problems with this basic idea, (1) it is unknown if the combined low sulfur diesel fuel and catalytic trap would reduce emission below the levels currently achieved by use of B 100 biodiesel fuel and (2) the Berkeley Transfer Station has only one fuel tank and no convenient way to handle both B 100 biodiesel fuel and low sulfur diesel fuel.
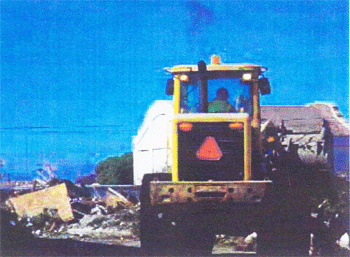 |
| Soot emitting from exhaust pipe of wheeled loader |
PARTICULATE EMISSION CONTROLS ON ALL DIESEL TRUCKS
Although it is beyond the scope of this investigation, the City should actively monitor programs at the California Environmental Protection Agency's Air Resources Board (ARB) regarding diesel particulate emissions. In August 1998, the ARB identified particulate emissions from diesel-fueled engines as a toxic air contaminant. Approval by the II-member board ended a near-decade long scientific investigation into the health effects of exposure to the fine particles and other pollutants in diesel exhaust.
Improvements to the Berkeley waste collection fleet would not only reduce emission at the Transfer Station but in all areas of the City traveled by the diesel powered waste collection trucks.The ARB is ready to release a garbage hauler truck rule as early as May 2003. The Rule is part of the California Diesel Risk Reduction Program. Over a period of several years the Rule is expected to require the retrofit of existing diesel engines to use reformulated ultra low sulfur diesel fuel (not available yet) and certified particulate traps. The City of Berkeley should carefully monitor this Rule and background information to determine any revisions to fuel use and diesel engine pollution control equipment. The following websites link discusses the California Diesel Risk Reduction Program and expected details of the Rule.
http://www.arb.ca.gov/diesel/dieselrrp.htm
http://www.arb.ca.gov /diesel/publicfleetwksp040303. pdfCLEANING
ESA observed that in comparison to other transfer station sites, the site is poorly maintained. ESA staff observed accumulation of dust on walls & horizontal surfaces inside the transfer station and outside of the building on paved surfaces. Regular cleaning of the transfer station can substantially reduce PM 10 generated by re-entrainment. The following measures suggest ways to better maintain the cleanliness of the transfer station site:• The utility hoses need to be used on a regular basis.
• ESA was informed that the City has dedicated a street sweeper to the Berkeley Transfer Station, but staff has not yet been trained to use the sweeper. After staff training is accomplished, the transfer station grounds should be swept daily. Regular sweeps should occur in the afternoon instead of the morning before dust can blow off site. Additional sweeps can also occur on an as-needed basis.
• Waste should be stored in piles as much as possible to minimize the surface area exposed to wind.• Pavement to the east of the Transfer Station building is in poor shape, and can probably not be swept effectively. A higher standard of maintenance for paved areas would help reduce dust accumulation (fewer cracks and pits where dust can accumulate) and would facilitate cleaning.
TRANSFER STATION DOORS
• Wind is capable of entering the doors and picking up dust as it moves through the facility. Given the current configuration of the transfer station, the doors have to remain open during the day.
Keeping the east and south doors to the transfer station closed during nighttime and when not in use would reduce wind blowing through the building. However the daily plot of PM 10 levels does not indicate that much PMlO blows off the site at night. If this measure is implemented, the doorway tracks need major repair.
POTENTIAL FOR BAGHOUSE
The City of Berkeley asked about the potential to filter all the air in the transfer station through a baghouse. Baghouses are typically used to filter out particles from combustion processes, where the heated flue gas is routed through fabric filters to remove particulates. ESA is not aware of any transfer station using a bag house-type solution for dust. ESA has observed negative air systems used in limited circumstances (such as demolition debris areas) but the exhaust is not filtered. The negative air is used to remove dust from the worker areas. The new South San Francisco Transfer Station has such a system.
ARCHITECTURAL MEASURES
WIND BREAK FENCE(S)
• Generally, wind that approaches the transfer station blows in from the southwest. A high, solid, fence system installed in-line with the west wall of the transfer station on top of the ramp wall could act as a wind screen. A second, similar, fence installed on the west wall of the ramp can act as a pre-buffer and potentially further reduce the tendency of wind to course through the transfer station building. A drawing is displayed in Figure 7. Estimated Cost: $7,000 - $9,000 for Fence 1, and $7,000 - $9,000 for Fence 2.
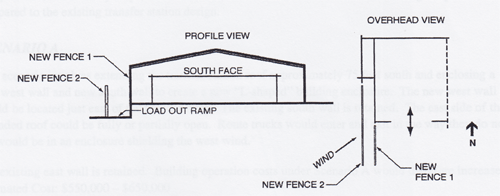 |
| Figure 7. Wind Break Fence(s) |
| SIGHT OBSCURING MATERIAL MOUNTED ON EAST SIDE OF FENCE |
Dust blowing across the transfer station blows through the chain link fence of the east side of the transfer station property.• Attaching a sight obscuring material to the new fence on the east side of the facility could (depending on the material) somewhat reduce the transmission of particulate matter (certainly in comparison to the new fence without vines, and maybe it would further reduce PM 10 better than the vines -- the effectiveness of the vines should be reviewed seasonally). Like the vines, the sight obscuring material would have a positive psychological effect in screening the facility. Estimated Cost: $9,000 - $13,000
REP AIRING SKYLIGHTS
• Many of the skylights near the peak of the transfer station roof were removed during a fire (partially visible in Figure 1). Wind is capable of entering the facility through these holes (approximately 3 by 8 feet), interfering with the high-pressure mist system, and stirring dust inside. In addition, the passage of wind across the roof of the building creates a low-pressure condition on the downwind side of the roof that sucks the dust-control mist out through the skylight openings, before it can suppress dust. These skylights should be replaced. The skylights need to be repaired before the mist system can be further fine-tuned. Estimated cost: $600 to $700 each. The transfer station has requested approval to make these repairs but they have not received funding to implement the repairs.
BUILDING ENCLOSURES
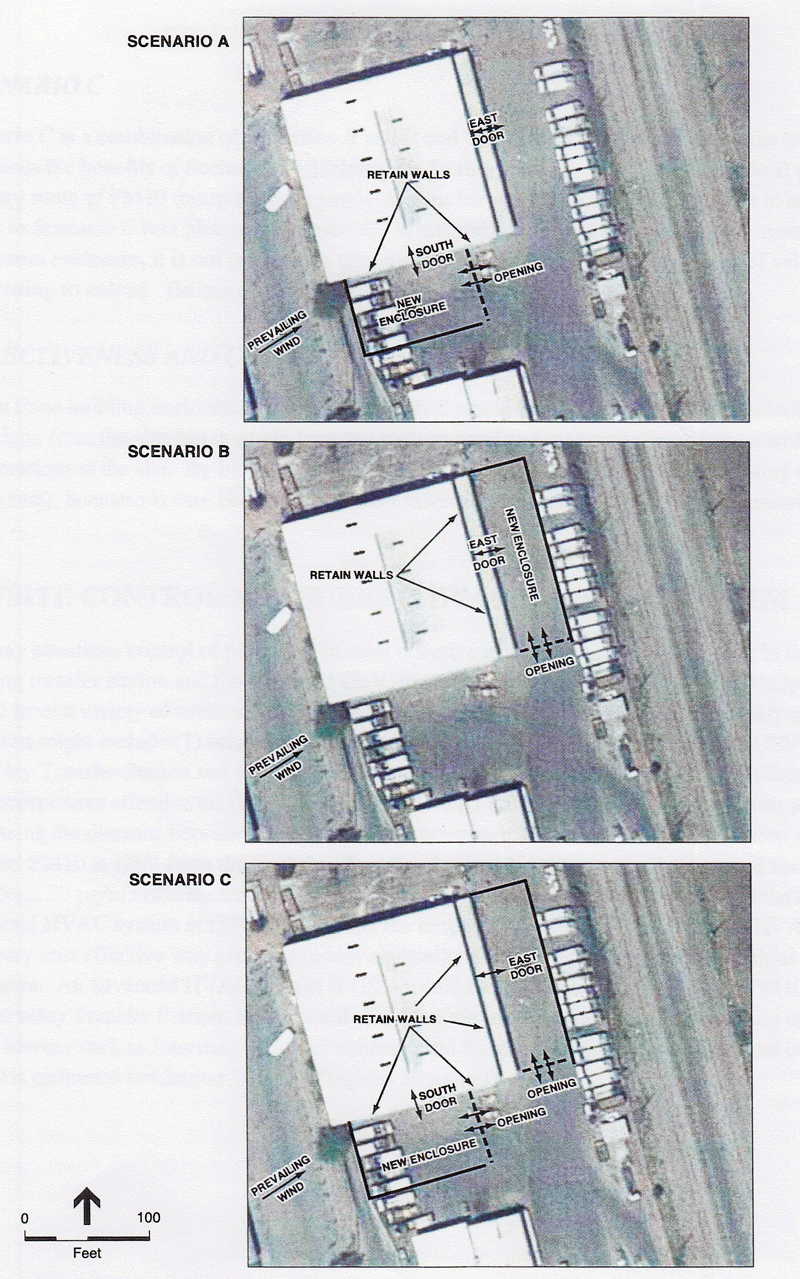
Potentially the most effective measure (and the most expensive) to reduce the off-site emission of PM 10 consists of more fully enclosing the building. This would include the addition of structural walls and roof. Three permutations are shown in Figure 8.
It should be noted that the existing arrangement of the Transfer Station utilizes and leverages functional openings (the south and east doors) and the space in front of them for vehicle circulation while maintaining minimum under-roof area for operations. By not using interior space for traffic circulation, building operations costs (e.g., lighting, maintenance) are kept to a minimum. Although the current design is efficient in many ways, scenarios A, B, and C should each reduce dust leaving the premises compared to the existing transfer station design.SCENARIO A
This scenario involves extending the transfer station roof approximately 75 feet south and enclosing a new west wall and new south wall to create a new "L-shaped" building enclosure. The new west wall would be located just east of the loadout ramp. The existing south wall is retained. The east side of the extended roof could be fully or partially open. Route trucks would enter and exit in the way they do now but would be in an enclosure shielding the west wind.
The existing east wall is retained. Building operation costs under Scenario A would therefore increase. Estimated Cost: $550,000 - $650,000SCENARIO B
Under Scenario B, the existing transfer station building would be extended to the east with new, solid, north, and east walls. Traffic would route in and out from an opening at the south side of the new enclosure. The trade-off, however, is that the approximately 90 feet that now exists from the east wall of the station to the east curb of the route truck parking is unlikely to accommodate interior circulation, a traffic lane to the north, and a parking row on the east for the route trucks. The truck parking to the east of the building would be lost with this option. Estimated Cost: $470,000 - $560,000 plus any costs associated with obtaining additional truck parking space.
 |
SCENARIO C
Scenario C is a combination of Scenarios A and B and would therefore involve the same trade-offs. It combines the benefits of Scenario A (shielding the facility from the wind) and Scenario B (blocking the primary route of PM 10 transport to the east). A complete enclosure strategy would be to add operating doors to Scenario C (not pictured in Figure 4). While the addition of operating doors would provide maximum enclosure, it is not practical in operational terms because of the frequency of vehicles entering and exiting to unload. Estimated Cost: $1,020,000 - $1,210,000
EFFECTIVENESS AND COSTOf the three building enclosure scenarios, Scenario C would be the most effective at reducing PM 10 emissions from the site, but it would have the highest costs and maximum interference with current flow of operations at the site. By blocking the route of transport to the east (effectively closing the 6 openings to the east), Scenario B may be the second most effective design for reducing PM10 emissions from the site.
OFFSITE CONTROL MEASURES (ADVANCED HV AC SYSTEM AT USV)In many situations control of pollutants is most effective if it is done at the source, but in the case of the existing transfer station and the proposed USV, some design features of the USV may help in reducing PM 10 from a variety of sources, not just the Berkeley Transfer Station. Environmentally preferable solutions might include (1) increasing the distance between the residential quarters at USV and the Berkeley Transfer Station and (2) designing a central HV AC7 system into the USV residential building that incorporates effective air filters for particulates and perhaps activated charcoal filters to scrub odors. Increasing the distance between the residential quarters and the Berkeley Transfer Station would result in reduced PM 10 at USV from the Berkeley Transfer Station, but the average background level would still be at least 39 ug/m3 (the measured local background). ESA has not fully investigated the details of an advanced HV AC system at USV (it is beyond the scope of this report). An advanced HV AC system may be a very cost effective way provides indoor air quality at USV regardless of the industrial activity in the local area. An advanced HV AC system at USV would not only assist in filtering the PM 10 generated by the Berkeley Transfer Station, but it would also filter the local background concentration of PM10 from other sources such as Interstate 80, other industry, and the railroad (the local background concentration of PM10 is estimated in Chapter 2 to be as high as 39 (ug/m3).
7 Heating ventilation air conditioning (HV AC) system
IV. CONCLUSIONS AND RECOMMENDATIONS
ESA has reviewed the extensive database of PM10 and PM 2.5 measurements that have been collected immediately downwind of the Berkeley Transfer Station. The measurements indicate that the Berkeley Transfer Station does contribute to the downwind PM10 burden (at a location 60 meters east of the transfer station doors) by an annual average concentration of about 6 ug/m3. During hours of operation, the annual average downwind concentrations at this same location increases up to about 70 ug/m3 (about 30 ug/m3 above the local West Berkeley background level). The local West Berkeley background level of PM10 is approximately 40 ug/m3 and does not vary much from hour to hour. The average 24-hour PM10 level at BAAQMD monitoring locations (the regional background) is approximately 20 ug/m3. There is no evidence that indicates the Transfer Station has a measurable effect on downwind PM2.5 concentrations.
There is considerable concern regarding the expansion of USV to a location immediately downwind of the Transfer Station near the location of the PM10 and PM2.5 measurements. It is a classic land use decision, "How close should residents be to industrial facilities?" Dispersion modeling by ESA indicates that PM10 levels drop dramatically in the range of 60- 120 meters from an area source of PM10 (such as the Transfer Station). So, the size of the buffer area between the transfer station and the USV will be a primary factor in the resulting PM10 concentrations at USV. The PM10 monitoring was conducted at a worst-case location and PM10 levels associated with the transfer station would be considerably reduced at the actual USV buildings (as proposed). Any additional movement of those buildings away from the Berkeley Transfer Station would have additional benefits according to the dispersion modeling conducted for this study.
There is currently no data that indicates the effectiveness of the control measures that have been installed at the transfer station (i.e., the mist system and the eastern fence). ESA believes these are both are good mitigation measures and will reduce the PM10 levels, especially with the fine-tuning of the mist system. The use of B 100 biodiesel fuel is also a positive factor in reducing PM10 and PM2.5 at the Berkeley Transfer Station. Using new CNG-powered route trucks is also an excellent proactive measure implemented on 4 new route trucks. Future decisions regarding fuels and engine controls need to fully consider compliance with the upcoming ARB Rule regarding garbage truck fleets.
Several new control measures have been identified in this report. Each of these measures will reduce PM10 leaving the site. The most effective and most costly measures involve enclosure of the transfer station. The following is ESA's summary assessment of the measures identified in Chapter 3.
1) PM10 is respirable particulate matter with aerometric diameter of equal to or less than 10 microns. It is a recognized air pollutant and is essentially: "fine dust particles." Typical dust will contain particles greater than 10 microns and less than 10 microns. This report will use the terms dust and PM10 relatively interchangeably. This report will clearly identify measurements of PM10 as being PM10 because that is all that is collected in the measurements. When referring to mitigation measures for PM10 the report will often refer to dust mitigations -- since reducing the dust will reduce the PM10.
2) PM2.5 refers to particulate matter that is 2.5 micrometers or smaller in size. 2.5 micrometers is approximately 1/30 the size of a human hair; so small that several thousand of them could fit on the period at the end of this sentence. The sources of PM2.5 include fuel combustion from automobiles, power plants, wood burning, industrial processes, and diesel-powered vehicles such as buses and trucks. These fine particles are also formed in the atmosphere when gases such as sulfur dioxide, nitrogen oxides, and volatile organic compounds (all of which are also products of fuel combustion) are transformed in the air by chemical reactions.
3) US EPA, A Comprehensive Analysis of Biodiesel Impacts on Exhaust Emissions, Draft Technical Report, EPA42O-P-02001, October 2002.
4) PMI0/PM2.5 Monitoring at Harrison Park. Berkeley, California, March 20, 2003; Prepared by Applied Measurement Science.
5) Final Report on Air Quality at the Proposed Site of the Ursula Sherman Village, March 15, 2002. ENVIRON International Corporation.
6) Lamoree, David P., and Turner, J.R., 1999, "PM Emissions emanating from Limited Access Highways," Journal of the Air and Waste Management Association Volume 49: PM-85-94. September."
| Control Measure | Effectiveness | Comments |
| Mist system operational improvements |
Improving the mist system could lead to major reductions in PM 10 emissions leaving the facility (estimate: up to a 40% reduction in PM 10 emissions from the tipping floor). The skylights need to be repaired to properly finetune the mist system. | Safety of footing needs to be monitored as more mist reaches the tipping floor. |
| Scale house improvements | These will result in less queuing at the scale house and result in less tailpipe emissions. This would result in minimal reduction of PM 10(estimate less than 5% reduction) | Although only minor PM 10 reductions would occur, some of the unnecessary queuing would include diesel engines and reduction of diesel particulates would be a benefit because they are identified as toxic air contaminants (TACs). |
| Particulate emission control on the main loader |
This vehicle is the largest emitter of diesel emissions at the facility. It is the first vehicle that should be upgraded. This would result in moderate reduction of PM 10 (estimate 5-10%). | This vehicle is already using B l 00 biodiesel fuel to reduce emissions. Further improvements are difficult to predict because of the lack of data regarding catalytic traps and B 100 fuel. Eventually, this will probably run on reformulated ultra low sulfur diesel fuel and a catalytic trap. |
| Particulate emission controls on all diesel trucks. |
The collection truck fleet does not operate much on-site, most emissions occur when they are running their routes. This would result in a moderate reduction of PM 10 (estimate 5-10%) | The improvements would generally be citywide. ARB rule soon to be released may dictate retrofit parameters. |
| Cleaning | Regular sweeping could have major benefits. All vehicles that move on the site cause the re-entrainment of dust -every time they move. If the dust is swept regularly it is not there to be reentrained. This could be a major improvement (estimate up to 30%) | |
| Transfer Station Doors | Being able to close the doors at night would reduce PM 10 emissions from the site to a minor degree. Having the doors operable and actually closing them each night would result in a minimal reduction. (estimate less than 5%). | The doors are assumed to remain open during operating hours. |
| Wind break fences | This measure could result in a minimal reduction. (Estimate up to 10% depending on other site conditions) | The new mini-storage building to the southwest may already be buffering the winds at the transfer station. |
| Sight obscuring material on new east side fence |
Depending on the material this might reduce PM 10 more than the vines that are planned. The reduction would be similar to the fence with the vines. (estimate up to 10% depending on other site conditions) | This is the last defense to reduce dust from leaving the site. |
| Skylight Repairs | This measure could result in a minimal reduction (estimate 1-10% depending on interaction with the misting system) | The mist system will not be able to achieve its most efficient level unless the skylights are repaired. |
| Building Enclosure A | This encloses the south area. This should result in a major reduction in emissions (estimate up to 50% efficient in reducing emissions from the tipping floor) . | Unfortunately the Transfer Station Building doors to the east would remain open and provide an easy conduit for PM 10 to leave the building. |
| Building Enclosure B | This encloses the east area. This should result in a major reduction in emissions (estimate up to 60% efficient in reducing emissions from the tipping floor). | |
| Building Enclosure C | This encloses the south and east areas of the Transfer Station. This is the maximum enclosure and should provide maximum containment of the PM 10 emissions (estimate up to 70% efficient in reducing emissions from the tipping floor operations) |
|
| Offsite advanced HV AC system at USV |
This measure will not reduce PM 10 levels leaving the site, but could result in a major reduce indoor particulate levels (estimate up to 80% reduction in USV buildings) | Costs have not been explored as part of this report. |
Source: ESA, 2003
All Rights Reserved

