
PM 10 Monitoring at the Berkeley Recycling Center Materials Recovery Facility
PM 10 Monitoring at the Berkeley Recycling Center Materials Recovery Facility
July, 2002 to January, 2003
Prepared for: Community Conservation Centers
Prepared by: Eric D Weinegar, Ph.D.
Applied Measurement Science
Fair Oaks, California
April 15, 2003
1. INTRODUCTION
Due to concerns about its contribution of fugitive PM 10 emissions to nearby facilities and exposure of its employees to these emissions, the Community Conservation Center contracted with Applied Measurement Science to conduct PM 10 monitoring at the Berkeley Recycling Center at the corner of Gilman and 2' Street in Berkeley.
The monitoring was to be conducted in two phases, first at "upwind" and "downwind" locations, and secondly inside the sorting building. The upwind/downwind monitoring was intended to provide a measure of the contribution to local PM 10 concentrations by facility operations. The sorting building monitoring was intended to assess the potential for high exposure to employees working in the semi-enclosed building around the sorting and packaging operations.
2. TECHNICAL APPROACH
2.1 Study Design
The technical approach used was to collect concurrent hourly PM 10 data at upwind and downwind locations using beta attenuation monitor technology. Following that period, the inside location would be monitored. The intended test time period was to collect data for two months at the upwind and downwind locations, and the inside location for three weeks.
2.2 Site Location
The Berkeley Recycling Center is located at the corner of Gilman and 2nd Streets in Berkeley, California. Figure 1 shows the general area. This area is primarily industrial, with the city Transfer Station to the north, and to the south, the Pacific Foundry and Steel Mill. Gilman Street is a major artery for access to and from 1-80. Interstate Highway 80 is located approximately 150 yards to the west.
Figure 1. Site LocationThe monitoring sites are noted in Figure 2. This figure was obtained from an aerial photo of the area.
The upwind site was located on top of a storage container on the southwest corner of the lot. The instrument inlet was at a height of approximately 12 feet above ground level. This location was designated as "upwind" due to the predominant wind direction as determined from the Harrison Field wind direction data.
The "downwind" site was located on top of a storage container along the north side of the lot, and was designated as such from the same Harrison Field wind data.
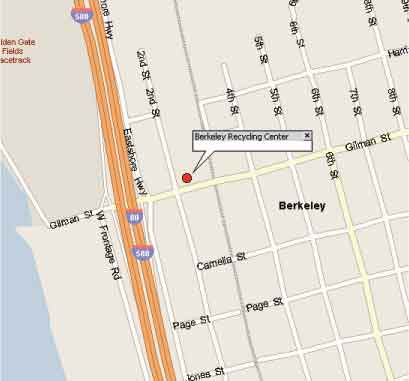
Figure 2. Monitoring Locations
2.3 Monitoring Equipment
The monitoring was conducted using a continuous PM 10 monitor, the MetOne, Inc. EBAM (Environmental Beta Attenuation Monitor). The EBAM is a portable version of the EPA- and California Air Resources Board-approved BAM 1020 continuous PM1O monitor. The EBAM is based on the attenuation of beta particles by particulate matter collected on a quartz fiber tape. The specific attenuation of the material collected on the tape is proportional to its mass.
The flow of the monitor is controlled volumetrically via the external temperature sensor and atmospheric pressure. The appropriate calculation is performed to yield a 16.7 liters per minute flow rate that is specified for accurate size separation of the particulate matter through the PM 10 virtual impactor inlet.
This mass detected is divided by the volume of air collected during the hour period. Subsequently, the hourly values are averaged into 24- hour periods, which then can be combined into longer term averages.
Following the monitoring, one of the EBAMs was co-located with the BAM 1020 at Harrison Park for a cross-calibration test. The BAMs in this case would be considered the more accurate instrument, and having been recently calibrated and audited, were deemed accurate. The results of this comparison showed that the EBAM provided data with a bias of approximately 15% low. Therefore, the concentrations for the EBAMs were adjusted by that amount. All data cited in this report reflects that calibration factor.
2.4 Upwind Monitoring
Upwind (concurrent with downwind) monitoring was conducted from late June, 2002 to mid December, 2002 at the top of the storage shed located at the southwest corner of the facility. The dominant wind direction of Southwest to Northeast was determined from PM 10 and meteorological monitoring that has been in operation since June, 2001 at nearby the City of Berkeley's Harrison Park play fields.
2.5 Downwind Monitoring
Downwind (concurrent with upwind) monitoring was conducted at the top of the storage shed located at the middle of the north fence line. This site was selected as the downwind location due to its position at the downwind side of the facility and due to the presence of the storage container to place the equipment. The height of the inlet was approximately 12 feet above ground surface.
2.6 Area Monitoring
Area monitoring was conducted for three weeks in the sorting building. The monitor was placed at the end of the sorting machine platform and run continuously during the period from December 18, 2002 to January 17, 2003. This placement was necessary due to it being the only spot that was not either occupied by material being processed or would be in the way for the forklifts, etc. However, due to its relatively protected indoor location, this site was judged to be adequate for being representative of area concentrations.
Hourly PM 10 data was collected in the same manner as the upwind and downwind monitoring.
2.7 Meteorological Data Collection
Local meteorological data from the Harrison Field air monitoring that was concurrently in operation during the CCC monitoring was used to establish the upwind/downwind wind pattern.
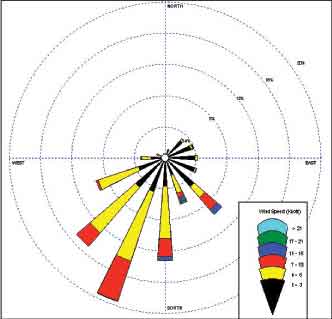
Figure 4. Wind Rose for Study Period: July to December, 2002.
This plot shows that the dominant pattern is for wind to come from the south to southwest direction, establishing the southwest monitoring location as upwind and the north location as downwind.
2.8 Monitoring Period
Monitoring was conducted at the upwind and downwind locations from July 1, 2002 to December 18, 2002. However, during that period, there were several instrument malfunctions due to pump failure. The EBAM is a relatively new instrument, and evidently some elements were not sufficiently tested. The sampling pump was replaced twice on each instrument, once being returned to the factory and once with an on-site replacement. The second pump was replaced by a new version that was promised to be more robust than the first type. This indeed turned out to be the case, as the final part of the monitoring period, data was collected without mishap.
In addition to the pump outages, there were several power problems related to the use of an extension cord that crossed a portion of the work area. When that cord was shifted to another building, those power outages stopped.
While the two sites were not contemporaneous for the entire study period, the number of days at each location plus the relatively constant wind directions suggests that the use of overall averages is valid. The examination of a subset of data that consisted of both monitors for more than 30 days mirrors the overall trends, thereby lending support to the overall method of combining data.
3. RESULTS
3.1 Upwind and Downwind PM1O Results
Hourly PM 10 concentration values show that the site produced sporadic spikes in concentrations of up to 0.350 mg/m3-a substantial hourly concentration. However, combined with the dominant lower values, the overall concentrations average to more reasonable values. As the discussion below notes in relation to diurnal patterns, the overall facility contribution to background PM1O is 0.005 mg/m3.
Figure 5 shows the upwind and downwind concentrations over the entire study period. The gaps in the data due to instrument difficulties are evident.
Figure 5. Upwind and Downwind ConcentrationsBoth upwind and downwind concentrations peaked at high values several times higher than the average, suggesting that facility operations were not the sole source for spikes. It is likely that the nearby industrial sites contributed sporadic high values, in addition to regular high values, as discussed below. In addition, mobile sources such as idling trucks nearby on 2nd street could directly impact the relatively small area bounded by the monitors.
Localized sources were certainly a cause for many of the spike values. There are several facility operations that potentially could cause short-term pulses of high dust concentrations. The specific correlation of activities with high concentrations cannot be made from this data set, but overall the activities do not appear to be major impact to the area concentrations.
Overall, the upwind concentrations were lower than the downwind concentrations by just a few micrograms per cubic meter. The data showed that the recycling center contributed just a few micrograms per cubic meter PM 10 at the downwind location. The average PM 10 concentration at the upwind site was 0.039 mg/m3 and at the downwind site was 0.044 mg/m3. During work hours (8AM to 5 PM), the concentrations were 0.037 mg/m3 at the upwind site, and 0.043 mg/m3 at the downwind site. During the off hours (non-work hours), the concentrations were 0.040 mg/m3 at the upwind site and 0.045 mg/m3 at the downwind site.
The diurnal pattern is useful to examine to determine hourly trends across the entire study period. Figure 6 shows the upwind and downwind concentrations on a hourly basis averaged over the entire study period.
Figure 6. Diurnal PlotFigure 6 shows hourly data are consistent with these averages. Midnight to 8 AM concentrations are fairly consistent between upwind and downwind, indicating no local sources. The divergence at midnight to I AM may be due to localized micrometeorological conditions that arise from calmer winds in the middle of the night.
A slight upward tick at 7 AM at both locations indicates morning rush hour traffic. This slight upward trend is only slightly indicated at the afternoon rush and only at the upwind location.
The daytime work hours of 8 AM to 5 PM values show that the downwind concentrations begin to increase around 8-9 AM, and then diminish briefly at the end of the day. The average difference between the upwind and downwind concentrations during the work day was 0.006 mg/m3. This amount-0.006 mg/m3-is the estimate of the contribution of the recycling center to the area PM 10 burden.
The downwind concentrations start to rise at around 5 PM and continue until a peak at 8 PM. At that time, both the upwind and downwind concentrations show a peak, although at different magnitudes.
This peak appears to be due to localized industrial activity. The fact that the downwind concentration is higher than upwind indicates an elevated source that impacts the upwind side less than the downwind. The plume appears to impact the upwind location less than the downwind location. This suggests that the emission point is elevated, that the plume is above ambient temperature, and therefore has some loft. The dispersion occurs normally in a Gaussian mode and therefore disperses over a distance. In the evening hours when the winds subside, the plume would be more distinctly formed and dispersion would occur over greater distances. Hence the conclusion that the plume originates at the foundry or steel mill and appears to impact the upwind and downwind locations in the noted manner.
Given the dominant wind direction, this peak must arise from some regular event at the foundry or steel mill. Attempts were made to ascertain what kind of regular schedule would correspond with this peak, but no definitive answers were obtained.
An examination of the weekday concentration trends shows some variation by day of the week, although only three days appear to be substantial-Sunday, Thursday, and Friday. Figure 7 shows these data.
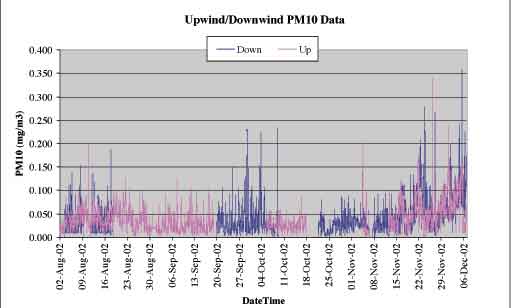
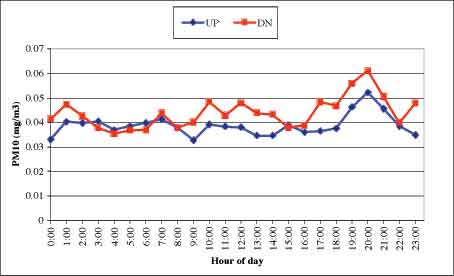
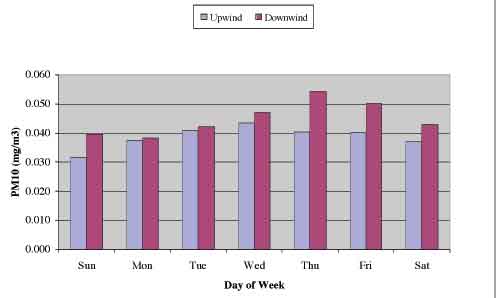
Figure 7. Day of Week Dependence
Overall, the facility operations do not cause an exceedance to any regulatory standards over the long-term since the average concentration is less than both the California and Federal ambient air standards. The California ambient air quality standard for PM 10 is 0.050 mg/m3 for 24 hours, and the Federal 24-hour standard is 0.150 mg/m3.
A total of 15 instances of the 24-hour California standard exceedances occurred at the upwind location, and a total of 20 at the downwind location occurred. One 24-hour period at the downwind site exceeded the Federal standard of 0.150 mg/m3.
The relatively high number of exceedances at the upwind site suggests that other upwind sources contributed to both those exceedances and the subsequent downwind exceedances. A daily examination of the exceedances does not shed much light on trends as there are both days with high upwind and low downwind, and vice-versa. The overall trend is more important, showing a minimal facility impact to the area concentrations.
Table I contains the 24- hour (midnight to midnight) average concentrations for the upwind and downwind locations. The blanks in the table represent periods of instrument down time.
Table 1. 24- hour Average Concentrations Concentrations in mg/m3.
UP=upwind, DN=downwind
August 2, 2002 to September 16, 2002
September 17, 2002 to November 5, 2002
November 6, 2002 to December 12, 2002
3.2 Sorting Building PM1O Results
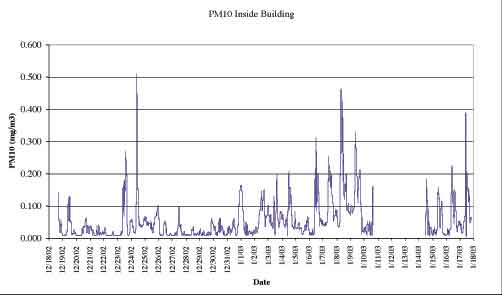
The sorting building was monitored for the period from December 18, 2002 to January 17, 2003.
A gap from January 10 to 14 exists, presumably due to a power outage, as there was no equipment malfunction during the entire period.
A total of 30 24-hour periods were monitored. The minimum for the period was 0.009 mg/m3 and the maximum was 0.5 10 mg/m3. The overall average was 0.054 mg/m3, which includes all 24- hours of the day. The daytime average was 0.060 mg/m3, and the off- hours average was 0.027 mg/m3.
Figure 8 shows the data over the 30 day monitoring period.
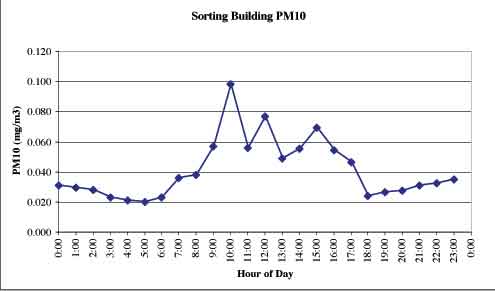
Figure 8. Sorting Building PM1O ConcentrationsThe periodic nature of the high concentrations is evident. When the hourly values are put into a plot of diurnal patterns, the daily work pattern emerges. Figure 9 shows the average of the hourly values over the day, with spikes at 10 AM, 12 noon, and 2 PM. The off-hour period reflects the ambient concentrations sheltered by the building.
Figure 9. Sorting Building PM 10 Diurnal Pattern3.2.1 Exposure Limits
A comparison to existing worker exposure standards shows that the PM1O concentration values measured did not exceed applicable levels. Two general standards are used for worker exposure: the Occupational Safety and Health Administration (OSHA), and the National Institutes of Occupational Safety and Health (NIOSH). For this sort of dust, NIOSH cites the OSHA standard.
No specific standard exists for dust generated from paper handling procedures. However, a general category of "particulates not otherwise regulated" exists to handle this kind of situation. The OSHA permissible exposure level (PEL) for particulates otherwise not regulated is 15 mg/m3 for total dust and 5 mg/m3 for respirable dust. While the PM 10 cutoff of the instrumentation used is slightly different from that used by OSHA, a cutoff of 10 microns is a generally accepted point for respirable dust. Therefore, the PM 10 values obtained by the EBAM can be used to compare against this standard. The PEL is defined over an 8-hour integrated work day period, so the work hours average is compared against the standard.
The work-day average for the sorting building was 0.060 mg/m3, a factor of 83 times lower than the standard of 5 mg/m3. The highest hourly concentration detected was 0.510 mg/m3, which is still approximately a factor of 10 lower than the standard. Therefore, it appears that the atmosphere in the sorting building does not pose a health standard for respirable dust from routine operations.
4. Summary and Conclusions
Monitoring for particulate matter of 10 microns aerodynamic diameter was conducted at two locations at upwind and downwind locations of the Berkeley Recycling Center from August to December, 2002. The PM1O monitoring at these upwind and downwind locations have shown that the impact from facility operations during work day is approximately 0.006 mg/m3. Higher spikes from localized transient operations do occur, but when averaged into the predominantly lower concentrations, the average for the upwind location was 0.039 mg/m3, and for the downwind location was 0.044 mg/m3. The value of 0.039 mg/m3 can be considered a general background value for the area, which is bounded by industrial and mobile sources.
Other monitoring was conducted inside the sorting building for the purpose of assessing the worker exposure to dust produced during operations there. The results showed an average of 0.060 mg/m3, a factor of 83 times lower than the applicable OSHA standard. Therefore, the dust in the sorting building does not appear to pose a hazard for workers under routine operations.
All Rights Reserved