
Berkeley, California July, 2001 to January, 2003
PART 1
PM 10/PM 2.5 Monitoring at Harrison Park Part 1
or continue to PM 10/PM 2.5 Monitoring at Harrison Park, Part 2
Eric D Winegar, Ph.D. Applied Measurement Science
July, 2001 to January, 2003June 3, 2003
1. INTRODUCTION
This report presents the final summary report of the PM10, PM2.5, and hexavalent chromium monitoring that was conducted at Harrison Field from July, 2001 to January, 2003. This monitoring arose as part of the CEQA process for developing the fields at Harrison Park, in which it was specified to conduct air monitoring to determine if the air quality was adequate for the type and level of use that would occur. To meet this requirement, the Parks, Recreation, and Waterfront Department for the City of Berkeley contracted with Applied Measurement Science to conduct air monitoring for PM10 and PM2.5 for a period of one year (extended to 19 months due to instrument problems and lost data) to assess the impact of local industry and mobile sources on the air quality at Harrison Park. This study was a follow-up to a short-term (2-day) study in 1997 that assessed a wider range of toxics and criteria pollutants.
As an adjunct to the air monitoring, a risk evaluation would be performed using the collected data, to provide input to parents, young people, and other users of flu park so that they could determine their level of participation based on their personal health history. This risk evaluation was performed by Dr. Charles E. Lambert of McDaniel Lambert, Inc., and is included as an appendix to this report.
This report provides an overall summary and conclusions from the data that has already been posted and provides a health risk evaluation in relation to that data. Throughout the program, data had been posted at the AMS web site: www.AirMeasurement.comlBerkeley.html.
Data files have been available for download at that site in addition to the City of Berkeley web site, at the Parks, Recreation and Waterfront Department page: www.cityofberkeley.info/parks/parkspages/harrisonairquality/HarrisonFieldFinalReport.pdf In addition, the full data set is included in this report as a CD due to its large size.
The PM10 and PM2.5 monitoring were the primary objectives of this program. However, due to the discovery of hexavalent chromium contamination at the skate board park at the southeast corner of the park after the primary monitoring had commenced, additional monitoring for hexavalent chromium was conducted to determine if any concern should arise to inhalation from that pathway. The results of that monitoring effort is included in the appendix.
2. TECHNICAL APPROACH
2.1 Study Design
The study design consisted of the straightforward collection of PM10 and PM2.5 concentrations at a single point at Harrison Field for a one-year period. The method used was to be defensible for state and local regulatory agencies, and applicable for any risk evaluation purpose. Local meteorological data was also to be collected that would be representative of this site.
Based on these criteria, the MetOne, Inc. (Grants Pass, OR) Beta Attenuation Monitor (B AM) Model 1020 was selected as the monitor for PM 10, and the ES-MO Laser Diode Monitor for PM2.5. Following equipment problems with the ES-MO, it was replaced with a second BAM 1020 for PM2.5. Details relating to these instrumental issues will be discussed below.
For all parameters -PM10, PM2.5, and wind speed/wind direction-semi-real-time (on an hourly average basis) concentrations were collected. The hourly data would be used to determine diurnal patterns for pollutant concentrations and could be used to ascertain potential sources along with 24-hour and longer averages.
The hexavalent chromium testing is described in Appendix 2.
2.2 Site Location and Description
Harrison Park is located at the end of Harrison Street in West Berkeley, at the intersection of Harrison and 4th Streets. The park includes several play fields, the city homeless shelter, a skate park, and the park utility building that contains restrooms and storage, etc. Figure 1 shows the placement of the park in the general West Berkeley area.
Figure 1. Site LocationFigure 2 shows a close-up of the area. This figure shows the proximity of the Transfer Station to the monitoring site. Two key areas of concern were the diesel trucks, which are parked along the eastern fence line of the Transfer Station, and the unloading areas at the transfer station itself. A lesser potential source was the driveway areas throughout the site that have been observed to have substantial dust generation. The rail tracks occupy the space between the western edge of the fields and the Transfer Station.
Figure 2. Close up of Harrison Park Area
Figure 3 shows an aerial photo of the larger area surrounding Harrison Park. The area to the south of the park is emphasized due to the dominant S to SW wind direction-other northerly sources are not only more distant but are not in line from the wind direction data. Inset into this photo is the wind rose for the study period showing the dominant wind origins.The area to the south of the park included other potential, but more distant sources that might impact the air quality at the park. These sources include Gilman Avenue, Interstate Route 80, and Pacific Steel and Foundry. Some questions had arisen regarding the possible contributions from the Berkeley Recycling Center on Gilman and Second, but testing at that site proved a minimal impact to the surrounding area from their operations and provided valuable information regarding the general background concentrations in the area.
2.3 Monitor Siting
The specific monitoring location at the park was selected on the basis of several criteria. First, a worse case location--e.g., a location close to the western side of the park--was selected so that there would be a built- in conservatism in all data collected.
Standard EPA siting criteria were applied as much as possible. These criteria include guidance for where to place the monitoring site as well as probe height and configuration. However, the specific purpose of this study precluded adherence to standard siting criteria, such as placing the sampler away from nearby sources that might impact the data collection. Such a nearby source was the city Transfer Station, which is located approximately 30 yards from the monitoring shelter. In addition, the monitoring equipment was approximately 10 yards from an active railroad, with passing trains approximately once per hour.
Another key aspect in monitoring set up was the placement of the instrument inlets at a height of 15 feet above the ground. This height was in conformance with EPA siting criteria and was designed to capture a "neighborhood" area of representativeness. Any lower level, such as at breathing level, would tend to capture emissions generated locally such as drive-by dust or play-oriented dust, which would obscure the true purpose of the monitoring. Breathing zone height testing is generally reserved for personal sampling, such as in occupational settings and is not indicated for ambient air monitoring.
Figures 4 to 9 show the surroundings at the monitor site. Figures 8 and 9 show the city Transfer Station with and without its full complement of haul trucks. In Figure 8, the east side of the Transfer Station is seen where other haul trucks and small trucks discharge their loads. During the dry summer months, distinct plumes of dust were seen emanating from this area as loads were discharged. These plumes were easily detected as large peaks in the hourly data. More detail on these plumes will be presented below.
2.4 Monitoring Equipment
Three configurations of equipment were used throughout the monitoring project. The first configuration consisted of the MetOne, Inc. BAM 1020 (beta attenuation monitor) equipped with a PM10 virtual impactor inlet, and a MetOne, Inc. ES-MO Laser Dust Monitor (LDM) equipped with a cyclone PM2.5 inlet. The BAM was selected for PM1O since it is an EPA Federal Reference Method equivalent, which provides method defensibility. Since PM2.5 was considered a secondary parameter, cost savings could be achieved by using the less expensive ES - MO, although its limitations were recognized as a non-equivalent method.
The second configuration was to replace the LDM with a second BAM for PM2.5. This change in configuration was made in January, 2002 due to continuing problems with the LDM instrument. Although the instrument had been newly refurbished and upgraded by the factory, it never provided the data quality that was needed for this program. This became evident soon after start of the program and was manifested by large incongruities between its data and the PM10 BAM data. After two return trips to the factory for examination and adjustment, it was determined that the LDM as unsatisfactory for this program, and the acquisition of a new BAM for PM2.5 was initiated. This culminated with installation of a new BAM 1020 and the start of PM2.5 monitoring on January 15, 2002. Due to the loss of the initial six months of PM2.5 data, it was decided to extend the end of the monitoring period from June 30, 2002 to January 15, 2003, thereby making a full year of monitoring data.
The third configuration was the change from a metered flow rate on the PM1O BAM 1020 to volumetric flow control. This occurred in September, 2002.
The use of the BAM technology was consistent with state of the art air monitoring technology. The BAM is an EPA- and California Air Resources Board-approved continuous PM10 monitor. Much of the EPA and CARB continuous monitoring for these parameters is currently conducted using the BAM.
The BAM is based on the attenuation of beta particles by particulate matter collected on a quartz fiber tape. The specific attenuation of the beta particle flux by the material collected on the tape is proportional to its mass.
The air flow into the monitor is controlled by either a metered mass flow or volumetrically via external temperature and atmospheric pressure sensors. For the metered flow, the flow is set by a calibrated valve and is intended to not vary from that setting. For volumetric flow control, continuous calculations are performed to ensure a 16.7 liters per minute flow rate that is specified for accurate size separation of the particulate matter through the PM10 virtual impactor inlet. The PM10 BAM operated under metered flow from inception to September, 2003, at which point it was converted to volumetric flow control.. The PM2.5 system was always under volumetric control, which is specified for that parameter due to its sensitivity to current conditions.
This mass detected by the beta attenuation is divided by the volume of air collected during the hour period (1 cubic meter) to yield the mass per actual volume. Subsequently, the hourly values are averaged into 24-hour periods, which then can be combined into longer term averages.
The BAMs were placed in a wooden shelter constructed specifically for the monitoring. The shelter was air conditioned during the summer months, and in the winter was warmed by the heat from the air pumps. Between the pump heat and the air conditioner, the shelter maintained a temperature within the instrument's specifications. Figure 10 shows a photo of an BAMs in the instrument shelter
Figure 11 shows the entire instrument shelter with inlets and meteorological sensor. The photo shows the extra inlet and control box for an EBAM instrument during a comparison test. The two inlets on the left and right are the PM10 and PM2.5 inlets.
The meteorological sensors for wind speed and wind direction were an integrated sonic anemometer and wind direction sensor from MetOne, Inc. Instead of using the usual mechanical means to measure these two parameters, a sonic anemometer uses sound waves and the effect of moving air on the speed to detect a wind speed and the direction it is coming from. Functionally, the sonic sensor set was identical to the mechanical version and provided equivalent data.
2.4.1 Instrument Quality Assurance
Throughout the monitoring program, the instruments were frequently checked for standard quality assurance indicators. There were three primary indicators of instrument performance: detector span checks, flow checks, and leak checks. In addition, standard instrument maintenance included tape changes and inlet cleaning.
For detector span checks that assess the accuracy of detector response, the instrument has a built- in function for hourly calibration checks. This function is automatically part of the measurement cycle.
The primary external quality assurance check is for flow rate. Although the flow controller has a high degree of accuracy (± 1%), it can drift over time. Therefore, a flow check should be performed.
Two kinds of flow checks were performed. The first consisted of checking that the flow rate that is being registered by the instrument is the correct flow (16.7 liters per minute). This can be done without affecting the normal run of the instrument. This kind of check was performed once every approximately two weeks when data was downloaded.
The second type of calibration involves measuring the flow with an external calibration device and comparison to what is being shown in the instrument. This type of calibration was performed approximately every two months.
The specification for metered flow is that the flow rate would be± 1% of the set point. This specification was met for all check until the summer of 2002, after nearly a year of operation. At approximately that same time frame, the PM2.5 flow controller started to show deviations. Several tests were conducted during June, 2002 to determine the comparison between the metered and volumetric instruments. One outcome of these tests was the decision to convert to volumetric flow control for the PM10 BAM. This was accomplished in September, 2002.
A final measure of instrument performance consisted of an external agency audit. This was conducted by the Bay Area Air Quality Management District audit group. On December 18, 2002, both instruments were audited, with both instruments showing performance within BAAQMD and EPA specifications. The report is included as Appendix 3.
2.4.2. Instrument Maintenance
Instrument maintenance consisted of periodic replacement of the filter tape and cleaning of the PM10 virtual impactor and the PM2.5 virtual impactor/cyclone combination. The tape change is mandated approximately every two months under normal operation. There were a few instances of the tape running out and a replacement not made until later. In addition, there were 2-3 instances of the tape breaking or coming loose from its base.
Inlet cleaning was conducted approximately every quarter in conformance with specifications.
3. RESULTS AND DISCUSSION
The 19 months of monitoring for PM10 and 12 months for PM2.5 produced a large amount of data. Table 1 contains an overall summary of the data, including major statistical indicators. In addition, the completeness of the hourly data of the program is shown, an indicator for total fraction of data capture.
This table shows that the completeness for the PM10 was 86% 11,891 hours out of 13,556 hours., and 78% for PM2.5 -6,827 out of 8,329 hours. The completeness standard for EPA compliance monitoring is 75%, which was exceeded by both instruments.
3.1 Monitoring Data Summaries
Due to the massive amounts of hourly data that was collected during the study period (nearly 12,000 hourly PM10 values, and nearly 7,000 hourly PM2.5 values) little presentation will be made of that data. In addition, specific events that are documented by the hourly data are of little consequence in terms of the long-term health impact to persons in the area.
The focus will be on average concentrations, primarily 24-hour averages, along with monthly and annual concentrations. The hourly data was mostly used in elucidating any diurnal trends in the data, and the longer term averages were used in the health evaluation and comparison to state and federal air quality standards.
3.1.1 State and Federal Air Quality Standards
The basis for judging the health impact of the data collected are the State of California and the Federal ambient air quality standards. These standards are based on health impacts for large populations and are the basis for routine air quality monitoring.
The two standards that were used to assess the data were the California 24- hour PM10 standard of 50 ug/m3, and the Federal 24-hour PM2.5 standard of 65 ug/m3.
It should be noted that the PM2.5 standards have not been formally promulgated by the State of California. The foot note to this table taken directly from the California EPA website-cites expected action to promulgate a revised standard. However, during the program, no standard existed other than the Federal level, which was 65 ug/m3. Therefore, the PM2.5 data was compared against this standard in the data files.
Table 2 shows the Federal and State ambient air quality standards.
Table 2. Ambient Air Quality StandardsThese standards are usually used to assess data that are collected over long-term periods a determination of compliance to the standard generally requires three years of monitoring. In addition, it should be noted that these standards apply to monitor sites that comply with the usual EPA siting guidance, as noted above. Therefore, while these standards will be used as a comparison, a strict application is not indicated based on the intent of the standards. More information relating to the interpretation of the standard in regards to health standards is found in the Health Evaluation found in Appendix 4.
The monthly exceedances of the standards were included in each month's data report. A summary of these data are included in Table 3. This table shows that a total of 35 PM10 exceedances occurred in the six months of 2001 and 135 for the 12 months of 2002, which is more than double the rate of 2001.
Figure 12 shows the bar chart of the monthly averages and the PM10 exceedances for each month. The data also shows an increase in overall concentrations over time. It is not clear why this occurred.
3.1.1 Monthly Data Summaries
Table 4 lists the monthly averages for the study period. The data in this table also includes the exceedance of the24-hour California ambient air quality standard. As noted above, the 2001 data does not include the PM2.5 data due to instrument problems.
Table 4
July 2001 through February 2002
February 2001 through October 2002
October 2002 through January 20033.13. Background Data
The collection of background data was not an explicit part of this program, but would be useful in understanding the context of the data for the area. A recent monitoring program over several months at the nearby Berkeley Recycling Center (located at the corner of Gilman and 2nd Avenue) can assist in understanding background concentrations. The report for this program is included in the appendix for reference. The primary challenge to a realistic background concentration is in replicating a similar mix of nearby sources, particularly the mobile sources along 1-80. The Recycling Center monitoring met this goal well.
The Recycling Center program consisted of two EBAM (portable versions of the BAM instrument) monitors placed at upwind and downwind locations on the lot. The upwind site was near the corner of Gilman Avenue and 2nd Avenue. This site was well- situated to capture the heavy traffic along Gilman and emissions from Pacific Refining, from which it was kitty-corner.
The downwind site was located at the north end of the recycling center lot.
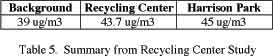
Data was collected intermittently over the period of July to December, 2002. The overall results showed that the recycling center operations contributed approximately 5 ug/m3 to the background concentration.
Table 5 contains the overall summary of the recycling center background data.
The value of 39 ug/m3 can be considered an upper bound to the background level at Harrison Park. During low activity periods, the hourly concentration may be lower, but on a 24-hour average basis, this value is representative of concentrations at that site.
For Harrison Park it would be considered an upper bound for the background because the Park is a approximately one hundred yards from the recycling center and more from the other sources, and therefore the effect of the BRC and other sources would be lessened somewhat by the distance from the recycling center and other sources through normal dispersion processes.
The contributors to the background to Harrison Park would include the BRC as well as the 1-80 corridor and the industrial operations in West Berkeley that are upwind of the site. Other area sources would include the train corridor, much of which is disturbed soil prone to wind erosion. This relatively high background level shows the impact of the highways and industrial sources in the area, which will be further considered in the section comparing Harrison Park data to other monitoring sites in the Bay Area.
3.2 Meteorological Data
Wind speed and wind direction data were collected on an hourly basis. As with the other data, there were some gaps in the wind data, but overall the data is complete enough to provide an accurate picture of the wind direction
3.2.1 Wind Rose
Figure 13 shows the wind rose for the entire study period, taken from the hourly wind speed and wind direction readings. A wind rose shows the direction that the wind is coming from. The size of each element indicates the fraction that is from that direction, and the color indicates the wind speed. This diagram shows that the majority of the wind data comes from the south to south-west-west directions at fairly consistent velocities.
Figure 13A shows a different representation of part of the wind rose data the frequency of the various wind directions. It shows that the dominant directions are from 161 to 249 degrees, for a total of 49 percent of the time.
The opposite of a wind rose is a wind vector plot, which shows the direction the wind is going towards It takes the same wind direction and speed frequency data and shows where the wind would be blowing towards.
Figure 14 shows an overlay plot of the wind vector for the study period, with the origin at the Transfer Station, assuming it to be the major source of emissions in the area. This plot shows that the range of wind directions includes a substantial portion towards the fields at Harrison, and impacted directly the monitor site for a large fraction of the time. This type plot is simplistic in terms of the direction and width of a plume that might be emitted from the Transfer Station, but is illustrative of the general trends that are possible.
For example, non-point or area sources such as occurs from discharging trucks or windblown dust are much less well-defined than point sources and their plumes would tend to be wide and more dispersed from the start. Thus the impacted area from many plumes from the Transfer Station would encompass a broader area not fully represented as the simple wind rose diagram would suggest.
The wind rose and wind vector plots also apply to sources further upwind such as the other industrial and mobile sources previously mentioned. It is the strength of that source that determines its impact to a receptor, assuming a consistent wind direction and speed. Therefore, as will be seen when more of the hourly data is examined, the proximity of the transfer station along with the wind vector suggests it to be a major source of the measured concentrations.
Figure 15 contains a diurnal plot of the wind direction and speed over the course of a day. This data is the average over the 19 months of data. It shows the changes that occur during the transition from early morning hours to the predominant daytime direction, moving more westerly. The wind speed shows a typical diurnal pattern of lower speeds during the night than the day.
The primary conclusion to be gained from this data is that the wind speed and direction are fairly consistent during the daytime hours when the major nearby sources are in operation.
The diurnal patterns of the wind speed and direction are represented in Figure 15, which shows that the wind displays a typical daytime/nighttime pattern of calmer winds at night and higher winds during the day. The wind direction shifts in this pattern also, from 160 (South-South-East) during the night to approximately 225 degrees (South-South-West) during the day, a shift of approximately 60 degrees. However, these changes do not affect the impact from the generally south direction where the majority of the stationary and industrial sources are.
3.3 Monitoring Data Details
The detail of daily monitoring data is overwhelming. A total of 481 days of monitoring was conducted, so a detailed examination of any number of days would encumber the overall conclusions to be gained. However, it is instructive to examine a "typical" day and a ":typical" month to show the peaks and valleys that occurred.
33.1 Example Daily Pattern
Figure 16 shows three days of particulate matter data in April, 2002-Monday to Wednesday, April 1-3, 2002. There is no significance to the days other than they seem to represent a typical work day period.
Figure 17 shows the hourly data averaged to show the diurnal pattern for those three days., and Figure 18 shows the daily wind data for this same time period.
These plots are instructive for several reasons. First, the curve in Figure 16 shows the daily pattern of high values that occurs during the daytime hours. The concentrations can reach up to almost 140 ug/m3 for short periods of time. It shows that these high values do not correspond to the morning or evening rush hours and instead most frequently appear just during the hours from 7 AM to 3 PM. Figure 17 shows the average of these three days, indicating the regularity of this pattern.
The PM 10 data show the greatest dynamic range from the normal background levels around 40 ug/m3 to the peaks around 120 to 140 ug/m3. The PM2.5 values do not display this same type of dramatic peaks and valleys. There were a few peaks that did occur for a few hours at a time, but they were only a factor of 1.5 times the general background level, not the factor of 3 times or more that is seen in the PM10 data.
The data summarized in Figure 18 shows that the wind speed and direction did not vary significantly over this same time period. There was one several hour period on April 1 in which the wind direction did change dramatically, but an examination of the PM10 data for that time period did not indicate any change in concentration, suggesting again that the overall background level stays fairly constant around 40 ug/m3.
An examination of many of monitored days shows the same pattern. It should be noted that these three days are work days when the Transfer Station was in operation. As will be shown in Section 3.3.3.3, the day of week profile demonstrates that Sundays have a substantially different profile of concentrations over the hours of the day.
Continue to PM 10/PM 2.5 Monitoring at Harrison Park, Part 2
All Rights Reserved