
Age-Adjusted Asthma
Hospitalization Data: 1994-96
for
Alameda County, California
Age-Adjusted Asthma Hospitalization Data: 1994-96 Alameda, Contra Costa, San Francisco and Solano Counties Regional Asthma Management and Prevention Initiative April, 1999
TABLE OF CONTENTS
Section I. Overview
Introduction
Comments/Summary
Methodology
Acknowledgments
Citations
Section II. Tables and Charts
1. Overall rates for each
Figure............All ages
Table.............All ages and Children <15
Figure............Children <15
2. Rates for counties by race/ethnicity
Figure............All ages
Table.............All ages
Figure............Children <15
Table.............Children < 15
3. Rates by county by zip code
Figure.............Alameda, all ages
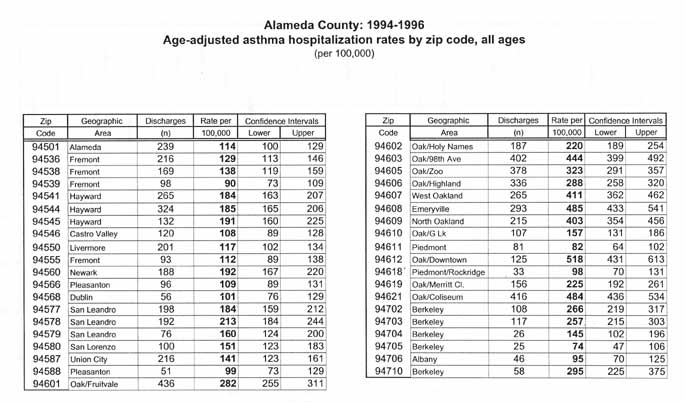
Table..............Alameda, all ages
Figure.............Contra Costa, all ages
Table...............Contra Costa, all ages
Figure..............San Francisco, all ages
Table...............San Francisco, all ages
Figure..............Solano, all ages
Table...............Solano, all ages
4. Patient days, charges and payment
Figure............Payment, all ages
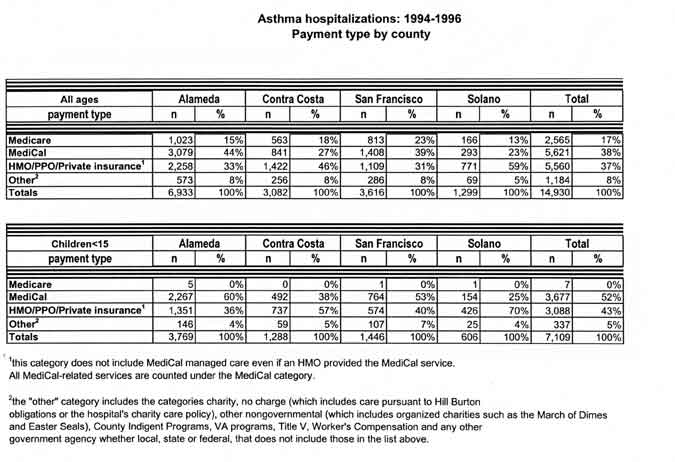
Table.............Payment by county
Table.............Patient days, charges by county
5. Maps
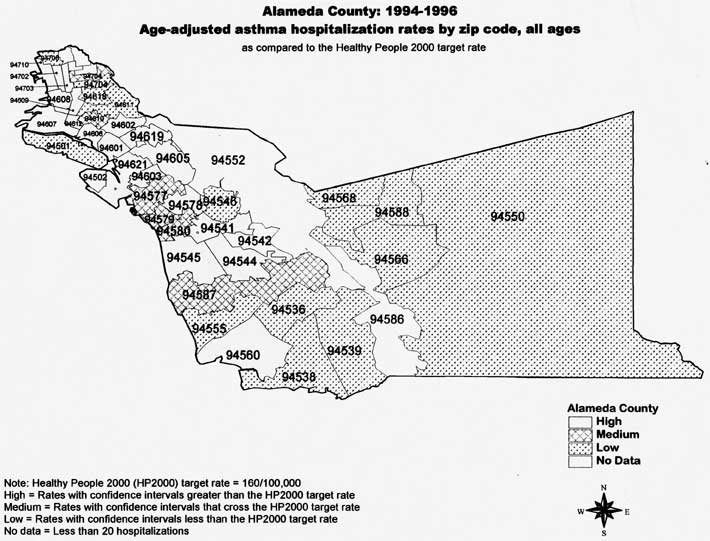
Alameda County by zip code
Detail of Berkeley 94710
Contra Costa County by zip code
San Francisco County by zip code
Solano County by zip codeIII. Section III. Frequently Asked Questions
This report was prepared by the Bay Area Regional Asthma Management and Prevention Initiative (RAMP), a collaborative of the Public Health Institute. RAMP is a four-county partnership that was formed to address asthma-related issues at the local level. The vision of RAMP is the development and implementation of a model for regional collaboration that addresses chronic disease in our communities. The mission is to decrease death and sickness associated with asthma among adults and children in Alameda, Contra Costa, San Francisco and Solano counties by the facilitation of a partnership of diverse organizations, institutions, and community residents that collaborate in the enhancement of clinical and community-based systems.
This report came about because health professionals, policy makers, and community people wanted local asthma data relevant to the Bay Area. I hope this document presents information in a way that is useful and understandable to all these constituencies. The first section contains an overview which includes the introduction, a summary and discussion of findings, methodology, and acknowledgements. The second section contains tables with the age-adjusted calculations and figures which visually represent these statistics. The third section contains "frequently asked questions" and explains both the concepts behind this presentation of data and the research still needed in order to learn more about asthma in this area. This report is limited to hospitalization data but we hope, in the future, to present more comprehensive information.
Nancy Warren Associate Research Scientist
RAMP 2140 Shattuck Ave. #309 Berkeley, CA 947080
RAMP is a project of the Public Health Institute (PHI)The purpose of this report is to describe the distribution of asthma hospitalization at a county and sub-county level for Alameda, Contra Costa, San Francisco, and Solano counties. This report examines asthma hospitalization rates geographically by age, race and payer source. The analysis is based on hospital discharges which recorded asthma as a primary diagnosis for the years 1994 to 1996.
Results
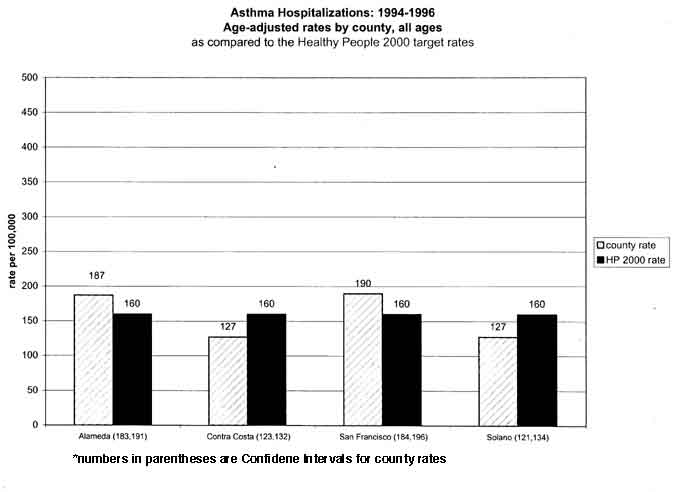
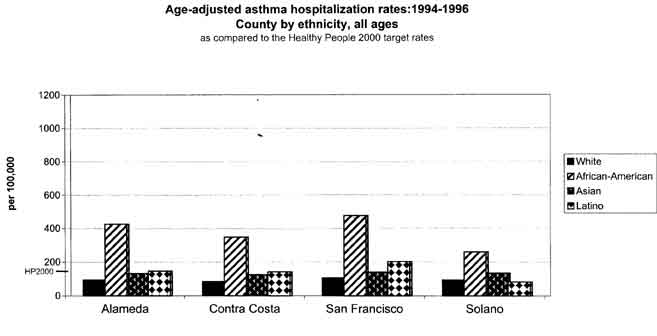
Similar to national data and previously published California data, the findings in this report indicate that children less than fifteen years of age, African-Americans, and those living in urban areas have high rates of asthma hospitalizations. (1, 2) High percentages of asthma hospitalizations in the four counties are insured by MediCal and Medicare. To put the data from this report in perspective, the asthma hospitalization rates are compared with the Healthy People 2000 National Health Promotion and Disease Prevention Objectives for asthma hospitalizations. (3)Age:
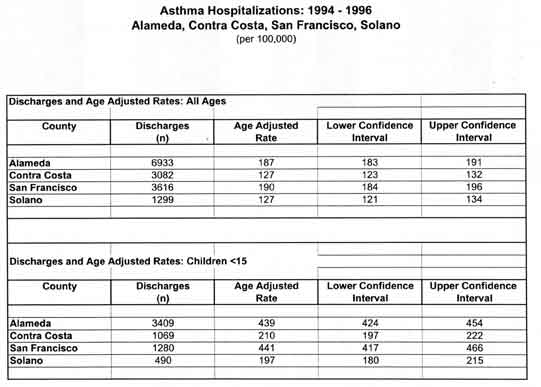
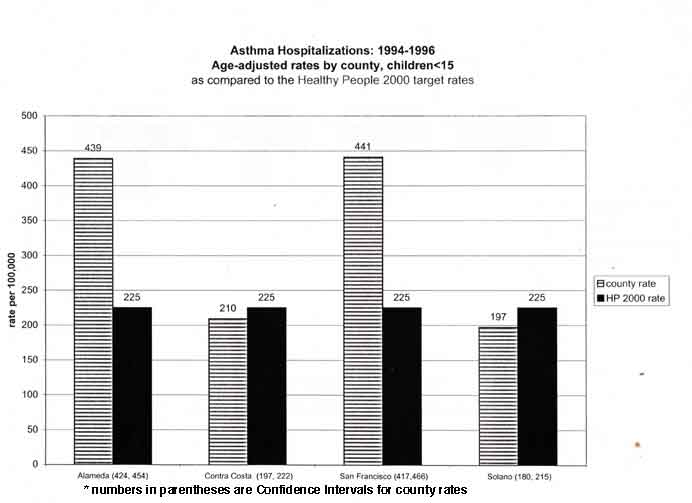
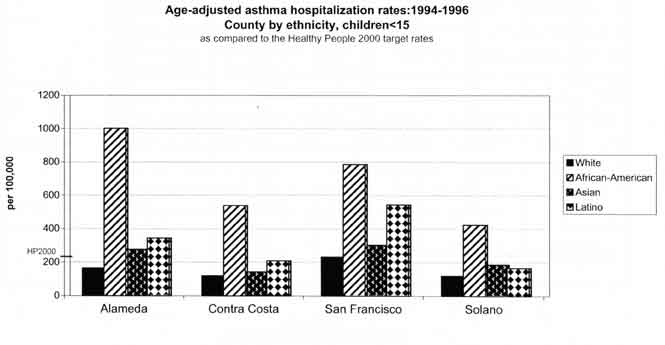
In every county, the rates for children under fifteen years of age are greater than the rates for all ages combined. Alameda and San Francisco county rates for children less than fifteen are almost twice the Healthy People 2000 target rate of 225 per 100,000 for this age group.
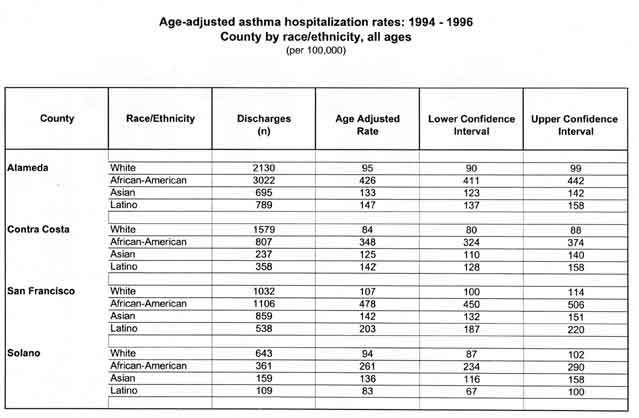
Race and Ethnicity:
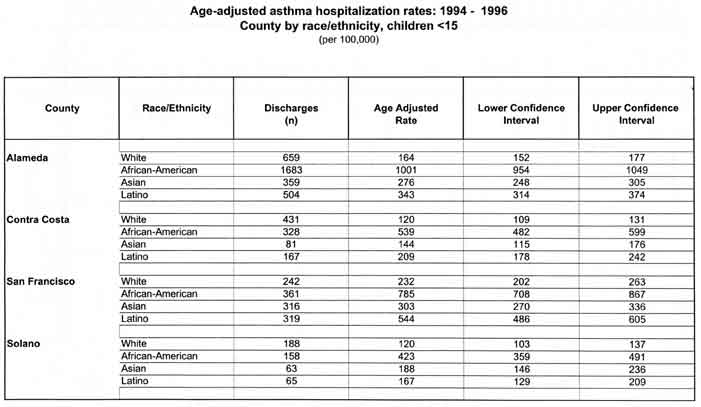
In every county but Solano, rates for African-Americans of all ages are higher than the Healthy People 2000 guidelines. In every county, rates for African-American children under fifteen exceed the Healthy People 2000 objectives. In Alameda and San Francisco counties, rates for Asian and Latino children under fifteen are higher than the Healthy People 2000 recommended measure. The highest asthma hospitalization rates in the four county area are observed in African-American children living in Alameda County where rates exceed 1,000 per 100,000 children. San Francisco County had the highest rates for White children (232 per 100,000) and for Latino children (530 per 100,000). San Francisco's Latino children had rates more than double that of the Healthy People 2000 objective.
Region:
The more urban counties, Alameda and San Francisco, have overall county rates for hospitalization well above the Healthy People 2000 targets while the more suburban counties, Contra Costa and Solano, have rates well below those targets. Almost half the zip codes in both Alameda and San Francisco have rates for all ages that are higher than the Healthy People 2000 targets. In contrast, a majority of rates for zip codes in Contra Costa and Solano fall below the Healthy People 2000 targets. Despite this, Contra Costa and Solano counties each have one or two zip codes in urban areas whose rates exceed the Healthy People 2000 guidelines for all ages.
Payment data:
Alameda and San Francisco counties have a higher percentage of asthma patients insured by MediCal than the other two counties. In contrast, Contra Costa and Solano counties have higher rates of private insurers paying for hospitalized asthma patients. Since, other than payment data, hospital discharge data does not include socioeconomic indicators, hospital rates cannot be calculated for different socioeconomic groups.
Discussion
Asthma hospitalization data are both extremely limited and very powerful. These data only record those patients so acutely affected they had to be admitted to the hospital for their condition. They do not reveal how many people have asthma, how many people visited private doctors or outpatient clinics for asthma, how many people visited hospital emergency rooms for asthma or how many people died from asthma. Nor do hospitalizations measure the extent to which indoor or outdoor environmental triggers exacerbate asthma. These are all areas that need more study.
Even with their limitations, hospitalization data are invaluable in describing unnecessary suffering. The patient's average length of stay was more than three days, which is quite a long time to have difficulty breathing. Asthma is classified as an ambulatory care sensitive condition which suggests that the vast majority, if not all, hospitalizations for asthma could be avoided. One study associated high rates of hospitalization for ambulatory care sensitive conditions with lack of health care access. (4) Another indicates that those asthma patients given the proper medication, education and information about environmental controls have dramatically reduced hospitalization rates. (5) And other studies indicate an association between high rates of pediatric asthma hospitalizations and indoor and outdoor environmental triggers. (6, 7) Unfortunately, it is beyond the scope of this report to comment on how these factors contribute to asthma hospitalization in the four counties. However, some specific questions are raised by the analysis presented in this report:
• Why do Latino and Asian children have rates that exceed the Healthy People 2000 objectives in Alameda and San Francisco counties but not in Contra Costa and Solano counties? While these Alameda and San Francisco rates are consistent with the California Chartbook rates, (8) Latino children in the west are generally identified as having lower rates. (9)
• What do the high rates in African Americans mean? Is race/ethnicity a marker for socioeconomic status, urbanization, health access, bias on the part of health professionals or a combination of these factors?
• Do the higher rates in urban areas represent the effect of environmental triggers, the difficulties with health care access or other, as yet unknown, factors?
Both the National Asthma Education and Prevention Program (NAEPP) of the National Institutes of Health, and the Centers for Disease Control emphasize the importance of organizing asthma coalitions at a local level. For these coalitions to be effective, they need research that is relevant to their region. Nowhere is this more important than in California, a state that is large in both landmass and population. In prioritizing counties in the state, one might dismiss Solano, with a low county asthma hospitalization rate of 127 per 100,000. Yet the sub-county analysis of Solano revealed a zip code in Vallejo that has a rate of 261 per 100,000 which greatly exceeds the Healthy People 2000 rate of 160. Even in counties such as Alameda and San Francisco, which had high county rates, there were distinct zip code level variations. Moreover, the association with asthma hospitalizations and urban areas almost demands sub-county analysis.
The analysis presented in this report is a first step to help county agencies and community based organizations plan, design and implement meaningful interventions to reduce the effects of asthma in their area. It may also help with community organizing and education.
Hospital discharge data in this report are from the Office of Statewide Planning and Development (OSHPD) Hospital Discharge Database from the years 19941996. (10) Only those hospital discharges with asthma as a primary diagnosis (ICD-9=493) were counted (11) Each discharge was counted separately and may represent multiple visits by some patients. All denominator data, including county, zip code, and race/ethnicity by county were taken from the STF3A and STF3B tables of the 1990 US Census. (12) Race/ethnicity were based on the 1994 OSHPD coding and consist of four groups: White (non-Latino), African-American, Asian, and Latino. Using the direct method, all rates have been age-adjusted using the 1990 California Population as the standard population. (13, 14) The age groups used were as follows: less than one, 1-4, 5-14, 15-24, 25-34, 35-44, 45-54, 55-64, 65-74, 75-84, eighty-five and over. Ninety-five percent confidence intervals were calculated using a square root transformation assuming a Poisson distribution. (15)
Zip codes were excluded if their combined cases were less than twenty. The National Center on Health Statistics considers calculations involving cases below this number to be inaccurate based on the Relative Standard Error (RSE). (16)
As a basis of comparison, I have used the Healthy People 2000: National Health Promotion and Disease Prevention Objectives for all ages and children. The Healthy People 2000 targets for all ages are divided into two different categories: "Whites" and "Blacks and others." There is only one Healthy People 2000 category for children. (17)
As much as possible, the methodology in this report mirrors that of the California County Asthma Hospitalization Chart Book by Julie Von Behren, Richard Kreutzer, and Daniel Smith of the Environmental Health Investigations Branch of the California Department of Health Services.
This report could not have been completed without the guidance, technical assistance and support provided by the RAMP Research and Information Work Group. I would like to thank the members of this group for their time and effort and their institutions for supporting them in supporting RAMP.
Jennifer Mann: Community Health Epidemiology and Disease Control San Francisco Department of Public Health
Rick Kreutzer: Environmental Health Investigations Branch California Department of Health Services
Julie Von Behren: Environmental Health Investigations Branch California Department of Health Services
Chuck McKetney: Public Health Division Contra Costa Health Services
Sandra Witt: Community Assessment Planning and Education Unit Alameda County Public Health Department
Eileen Yamada: Division of Chronic Diseases California Department of Health Services
Michael Lipsett: Air Toxicology and Epidemiology Section Office of Environmental Health Hazard Assessment California Environmental Protection Agency
Stephanie Bisson: Asthma Coordination Children's Hospital OaklandI would also like to thank RAMP's Director, Pat Porter, RAMP's Program Coordinator, Megan Webb and the Director of the Public Health Institute, Joseph Hafey for their encouragement, patience and support.
This report would not have been possible without contributions from our funding partners:
• Alameda County Health Department
• Contra Costa County Health Department
• Solano County Health Department
• San Francisco City and County Department of Public Health
• Kaiser Permanente
• Merck Pharmaceuticals
• Forest Pharmaceuticals
• The California Endowment1. Mannino DM, et a!. Surveillance for Asthma-United States, 1960-1995. MMWR. 1998,47, #SS-1.
2. California Department of Health Services, Environmental Health Investigations Branch. California County Asthma Hospitalization Chart Book. August 1997.
3. US Department of Health and Human Services. Healthy People 2000: National Health Promotion and Disease Prevention Objectives. Washington DC. September, 1990, p. 105.
4. Bindman AS, et al. Preventable Hospitalizations and Access to Health Care. JAMA 1995;274:305-311.
5. Lieu TA et al. Outpatient Management Practices Associated with Reduced Risk of Pediatric Asthma Hospitalization and Emergency Department Visits. Pediatrics. 1997;100: 334-341.
6. Malveaux FJ and Fletcher-Vincent SA. Environmental Risk Factors of Childhood Asthma in Urban Centers. Environmental Health Perspectives. 1995;103(6):59-61.
7. Bates DV. The Effects of Air Pollution on Children. Environmental Health Perspectives. 1995;l03(6):49-53.
8. California Department of Health Services, Environmental Health Investigations Branch. California County Asthma Hospitalization Chart Book. August 1997.
9. Ray NF, et a!. Race, Income, Urbanicity and Asthma Hospitalization in California. Chest 1998; 113(5):1277-1284.
10. Office of Statewide Planning and Development. Hospital Discharge Database. Patient Discharge Data Program, Sacramento, CA.
11. US Department of Health and Human Services. The International Classification of Diseases, Ninth Revision, Clinical Modification, ICD-9-CM. Third Edition. March 1989.
12. Census of Population and Housing, 1990: Summary Tape File 3 on the World Wide Web from CD-ROM prepared by the Bureau of the Census. Washington: The Bureau [producer and distributor], 1992.
13. Kahn HA and Sempos CT. Statistical Methods in Epidemiology. New York: Oxford University Press, 1989, pp.87-91.
14. California Department of Health Services, Environmental Health Investigations Branch. California County Asthma Hospitalization Chart Book. August 1997.
15. Miettinen OS. Theoretical Epidemiology. New York: John Wiley and Sons, 1985, pp. 137-139.
16. Division of Chronic Disease Prevention and Adult Health, NYS Department of Health. Rates Based on Small Numbers. Albany, NY. August, 1998.
17. US Department of Health and Human Services. Healthy People 2000: National Health Promotion and Disease Prevention Objectives. Washington DC. September, 1990, p. 105.In this four county region in California, the data we have analyzed on asthma in the general population is asthma hospital discharge data.
Q: What does asthma hospital discharge data tell you?
A: This analysis tells you the rate of hospital discharges for asthma in the counties of Alameda, Contra Costa, San Francisco and Solano for 1994-1996. We use hospital discharges instead of admissions because the final diagnosis in discharges is more accurate.Q: What is the difference between a number and a rate?
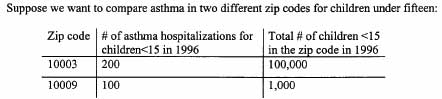
A: 1. The number of hospital discharges for asthma or asthma-related problems is simply added. 2. The rate divides the number of hospital discharges for asthma that occur in a specific time period by the population of the area. For example, if you have 10 hospital discharges in 1996 from zip code 10003 and 100,000 people who live in 10003, your rate for the area is one per one hundred thousand per year or 1/100,000 for 1996. The age distributions of different populations are important to consider. Age adjusted rates makes the rates possible to compare across regions with different age distributions. These figures are usually expressed in "per one hundred thousand."Q: Why use rates instead of numbers?
A:
You can see that there are more hospitalizations for children under 15 in zip 10003 than in 10009. But look at the total number of children in zip 10003 versus zip 10009. Since fewer live in 10009 than in 10003, the rate will be higher. For this age range in 10003, the rate would be 200 per 100,000 while the rate for 10009 would be 10,000 per 100,000. Note that the number of children under fifteen in zip 10009 is less than 100,000. At the zip code level the population is often under 100,000 even though the rate is calculated as per 100,000.
Q: What are confidence intervals?
A: Rates are not exact numbers. If you look at the zip code charts you will notice the lines. The lines represent confidence intervals and the point in the center of each line is the age adjusted rate. Confidence intervals reflect how stable the rate is. The longer the line, the less stable the rate. If the confidence intervals of two rates do not overlap then it is unlikely that the differences in rates are due to chance.Q: What does hospitalization leave out?
A: 1. How many people have asthma. This category would include the following:
• people who visit hospital emergency rooms for asthma-related emergencies
• people who visit doctors for asthma
• people who try to control their asthma without medical care, through over the counter medications they buy at the pharmacy.
2. How many people in your neighborhood were hospitalized for asthma. The information can be broken out both on a county and zip code level but these may not fit neatly into a neighborhood's or city's borders.
3. How many individual patients were in the hospital for asthma in a certain area. For example, if you know there are 10 hospitalizations in 94702, you don't know if that's 10 different people, 5 people in the hospital twice, or one person in the hospital 10 times. The fact that the information is reported in rates does not change this flaw. A rate in this case means that there are 10 hospital visits per 1000 people.
4. Why people were hospitalized. Most asthma hospitalizations are probably preventable and may be due to one of the following: the patient does not have a doctor to manage their care on a regular basis, or the patient's doctor is not treating them with effective medications or the patient is exposed to extraordinarily high indoor or outdoor environmental triggers or other factors, as yet unknown.Q: If they count the people in the hospital, then why can't they count the people who go to the doctor or to the emergency room or to the pharmacy for medications?
A: The state only requires that hospital discharge data be reported. There is no state or local agency which is in charge of collecting this other information.
• Each hospital may keep track of its own emergency room visits, but no central agency collects emergency room data so that rates can be representative you would need to have all emergency rooms in an area report their rates;
• Individual doctors and doctors in group practices keep records on their patients, but no central agency collects information from all doctors. In many cases, patient charts may not be computerized;
• Individual pharmacies also keep track of the prescriptions they sell, but most of these prescriptions are medications that may be used for other diseases besides asthma.Q: So, how would someone find out how many people have asthma in his or her neighborhood?
A: Through prevalence studies which tell us how many people have asthma in an area. The area may be a neighborhood, city, county, state, country or the world.Q: How would someone find out about the new cases of asthma?
A: Tracking only newly diagnosed cases is called incidence reporting. Studies of asthma incidence help us to determine what causes someone to begin to have asthma. For a chronic disease like asthma, the number of new cases (incidence) will usually be smaller than the number of total cases (prevalence). Usually, you need to know prevalence before incidence can be meaningful. This type of study is hard to do because you must follow a large number of people over a long time.Q: Why can't we use the asthma hospitalization data for this?
A: Hospitalization data only counts the most severely affected cases of asthma, and even then the information it gives you is limited. Prevalence studies would assess how many people had asthma, whether or not they were ever hospitalized at all. Incidence would count only the number of people who were newly diagnosed with asthma.Q: So how would we get an idea of asthma prevalence (existing cases)?
A: Through an asthma surveillance system, which could gather that information by conducting periodic surveys on a representative sample of the population.Q: What else would a surveillance system for asthma tell us?
A: A surveillance system could conduct studies of asthma-related office visits, emergency room visits and hospital discharges. This system could also keep track of those people who have died from asthma.Q: Do oilier diseases have surveillance systems?
A: Yes, many diseases have surveillance systems. These include contagious diseases, such as measles and tuberculosis, in addition to lead poisoning, an environmentally-related disease, or cancer, a chronic and often fatal disease.Q: Why doesn't asthma have a surveillance system?
A: Surveillance systems cost public money, either on the state, local or national level. Diseases must first be recognized as having a severe enough impact on the population before the money is spent on a surveillance system. This can become a catch-22. If we don't have information from surveillance, then how do we know if the disease is severe enough to warrant a surveillance system? Often, it takes political pressure for a disease to be recognized as worthy of the time and money surveillance costs.Q: Are there no other sources of asthma data available?
A: The state also collects MediCal data. Due to the shift to MediCal Managed Care, MediCal information for medical office visits may not be available in a few years.

All Rights Reserved